Arabidopsis thaliana
Common name: Thale cress
Genome Details
- Size (bp): 119,667,750
- Source: Phytozome ID: 167
- Reference: Lamesch et al, 2011
Taxonomy
- Phylum: Spermatophyta/Angiosperms - Eudicotyledons (Eudicots)
- Class: Magnoliopsida
- Order: Brassicales
- Family: Brassicaceae
Parameters Used
species others step all sensitive 1 evaluate 1 anno 1 mutation rate (u) 7.0e-9
Annotated data
This section provides a selection of the data produced during TE annotation, such as FASTA and GFF3 reports, masked files, .sum and .LAI outputs. It also includes visual representations (graphs) and the underlying data required to generate them.
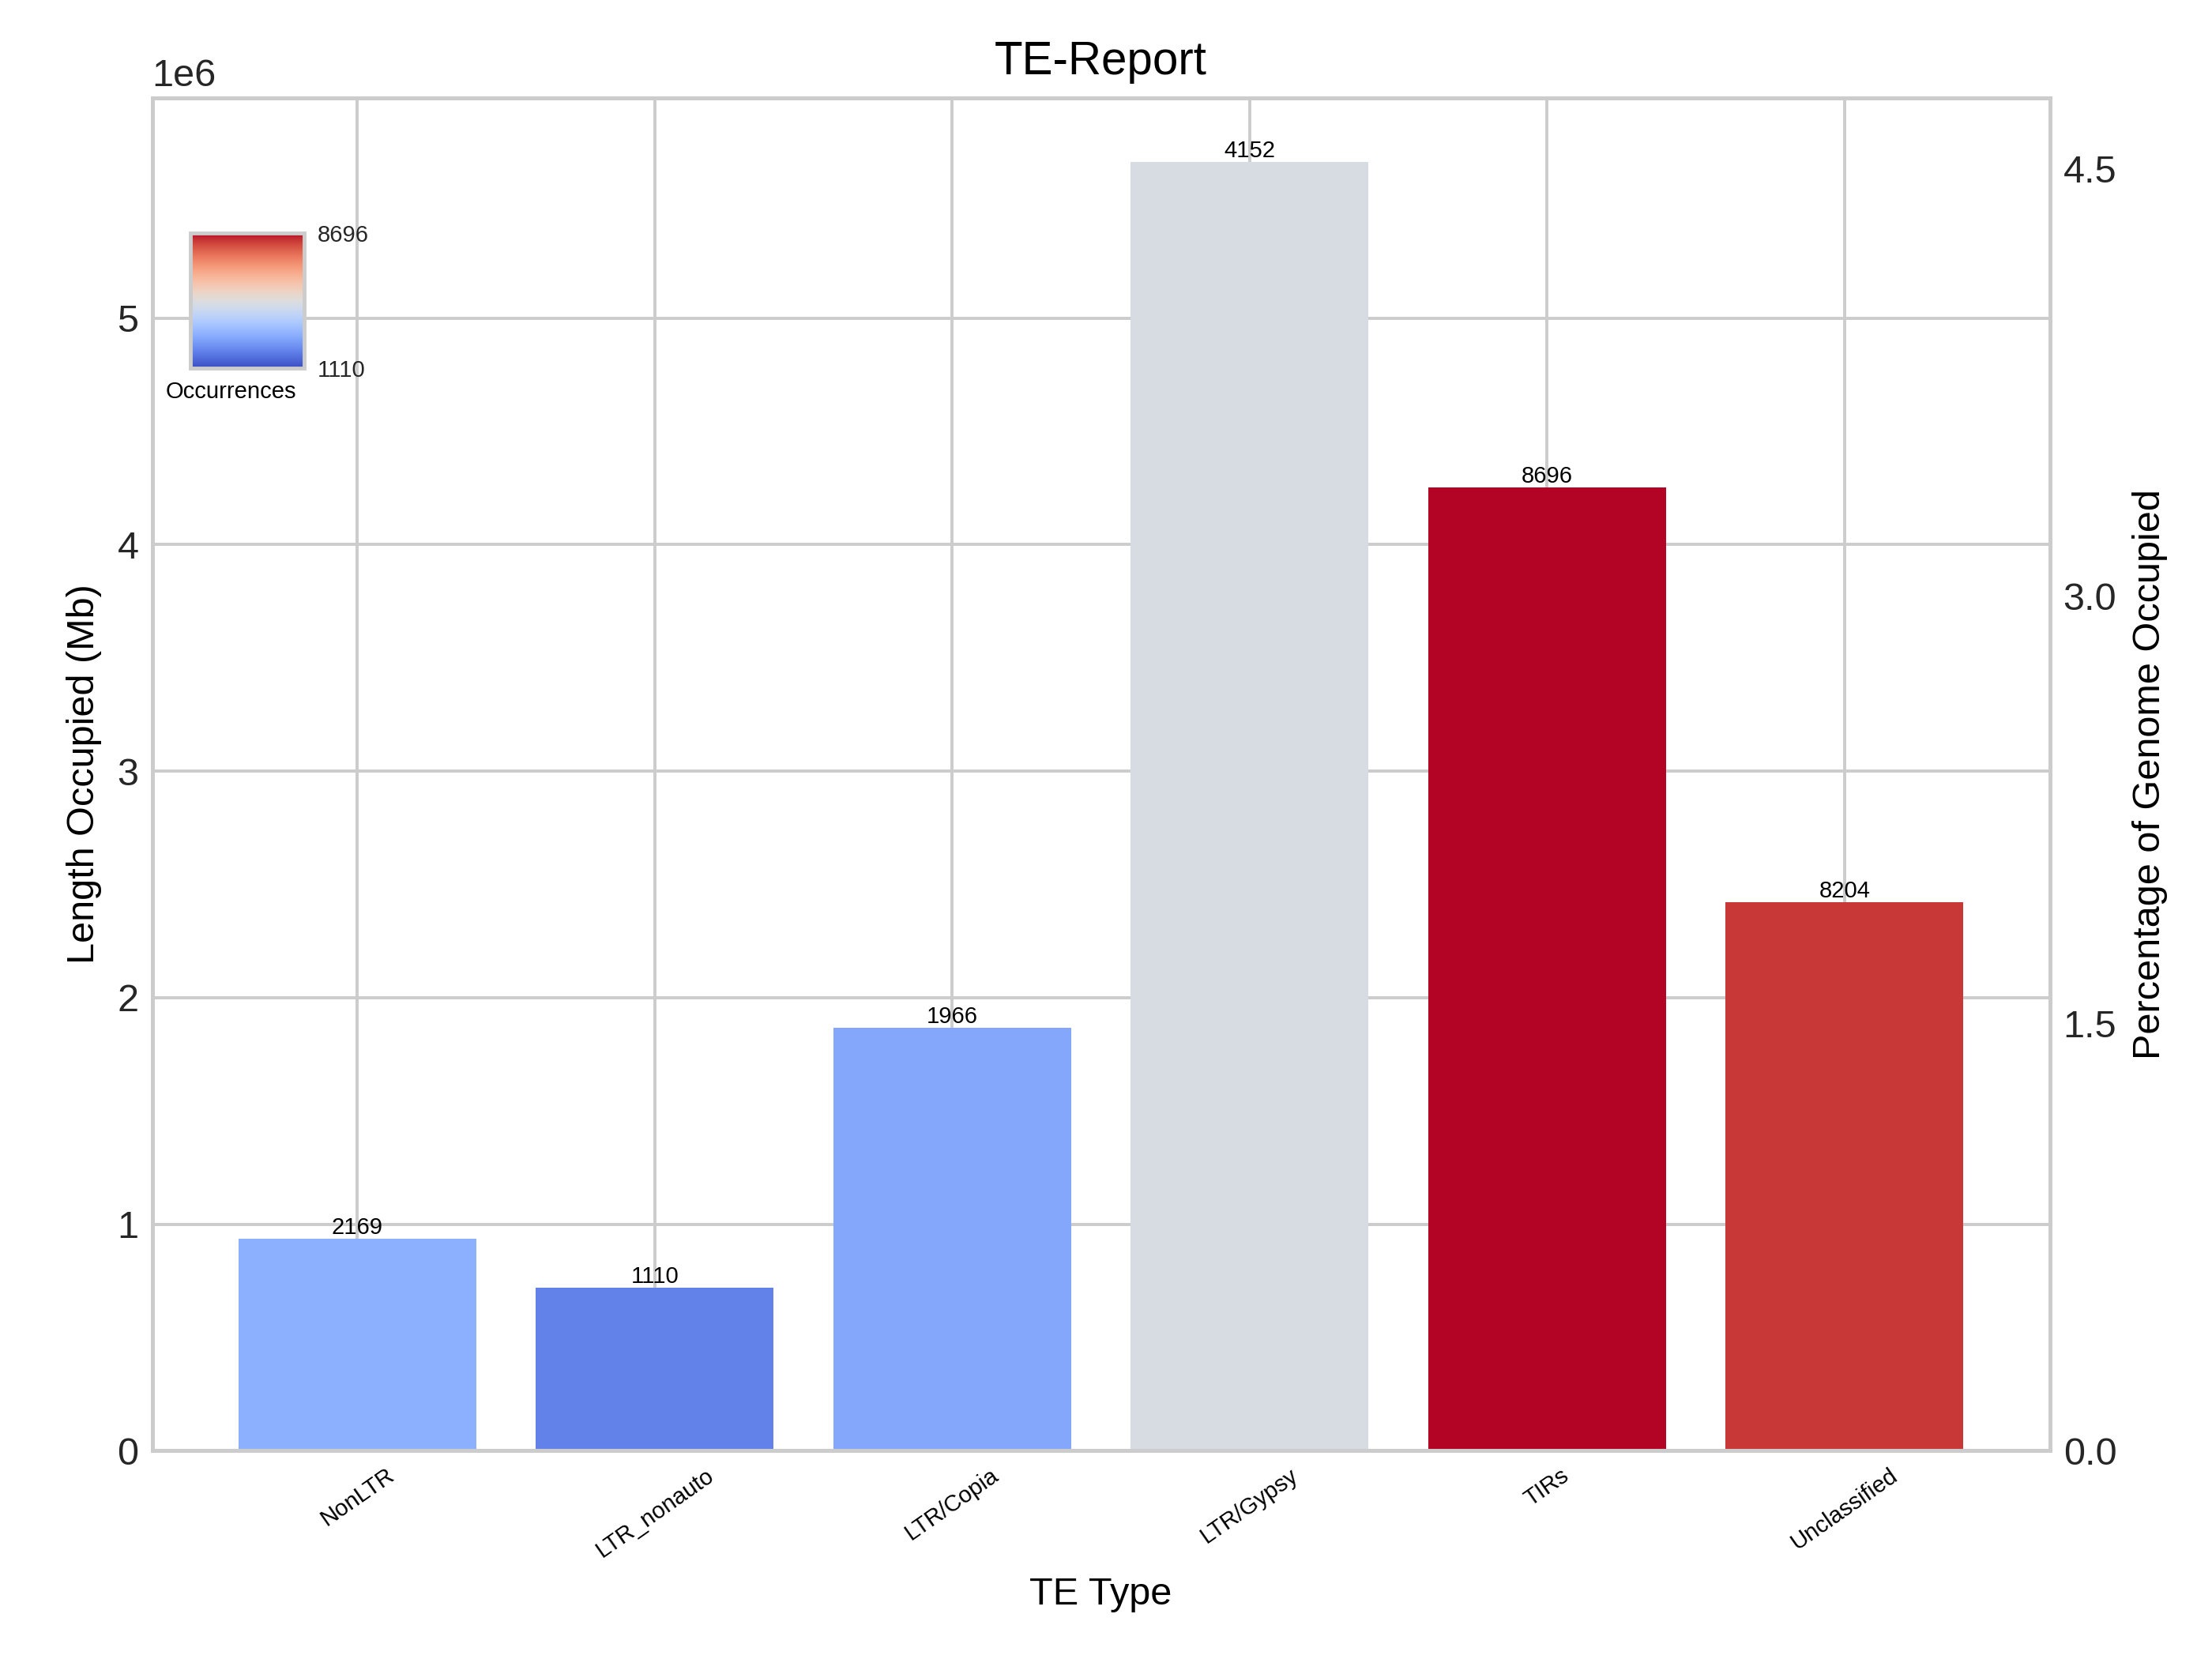
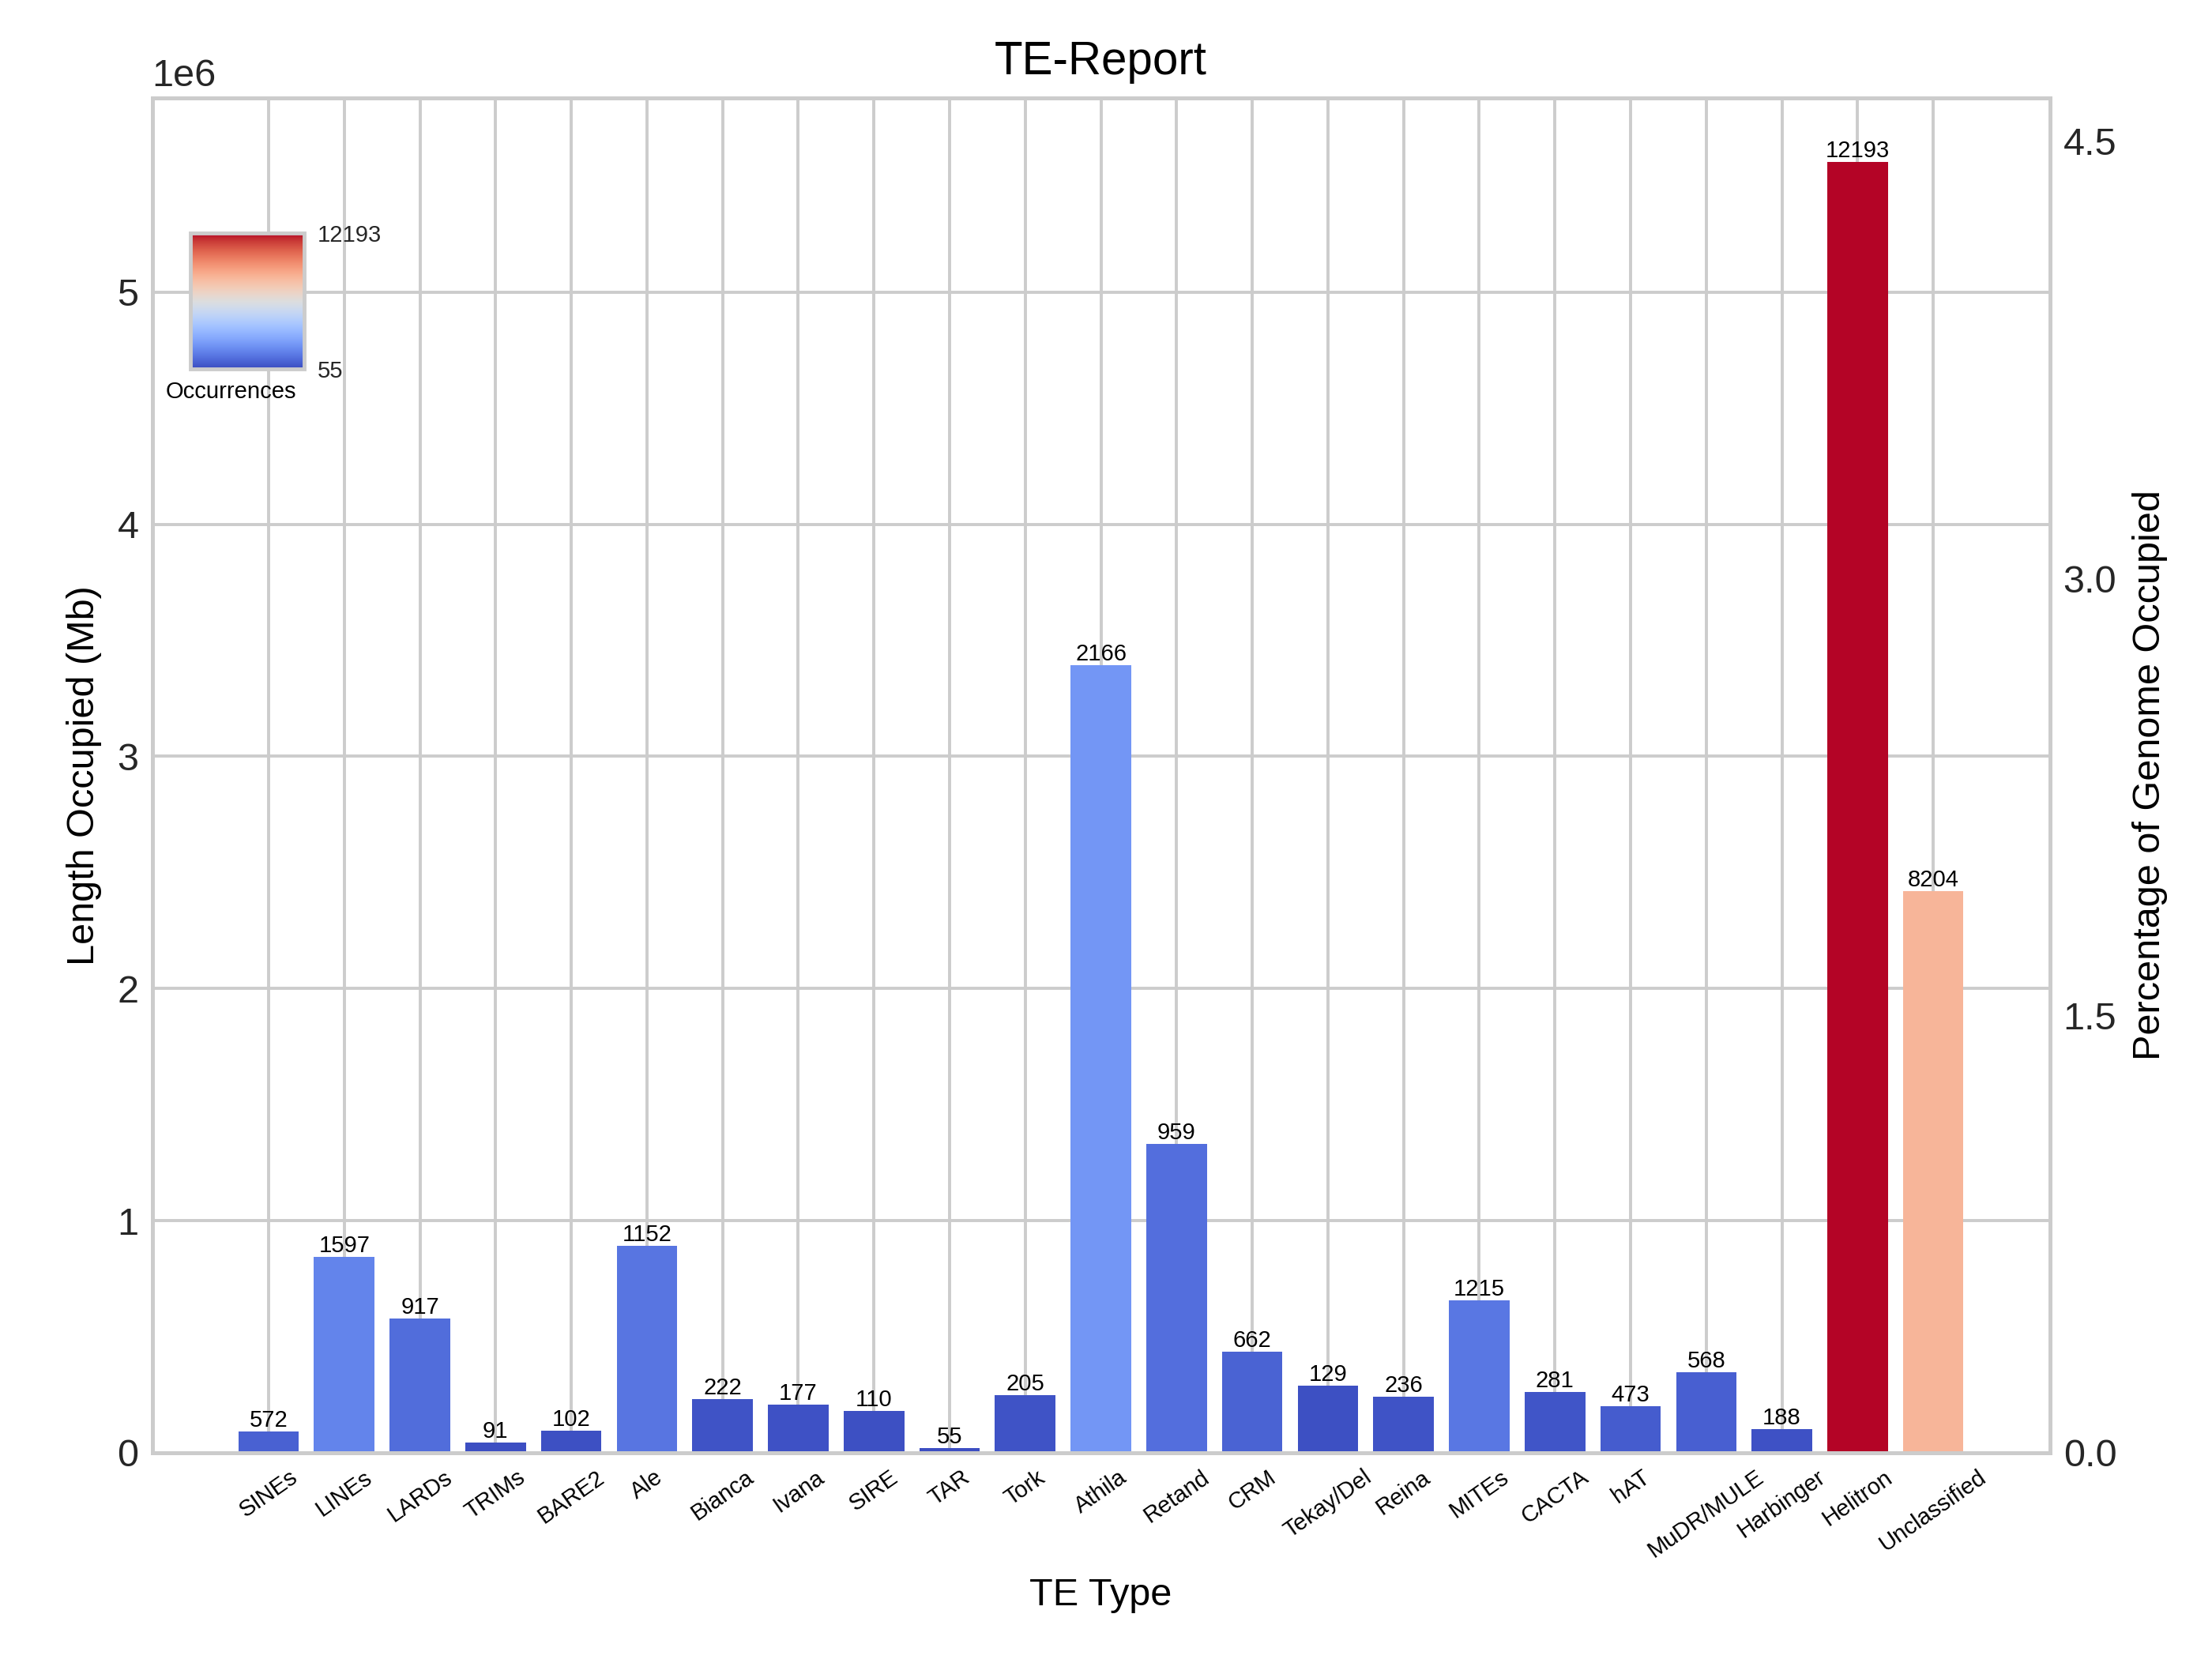
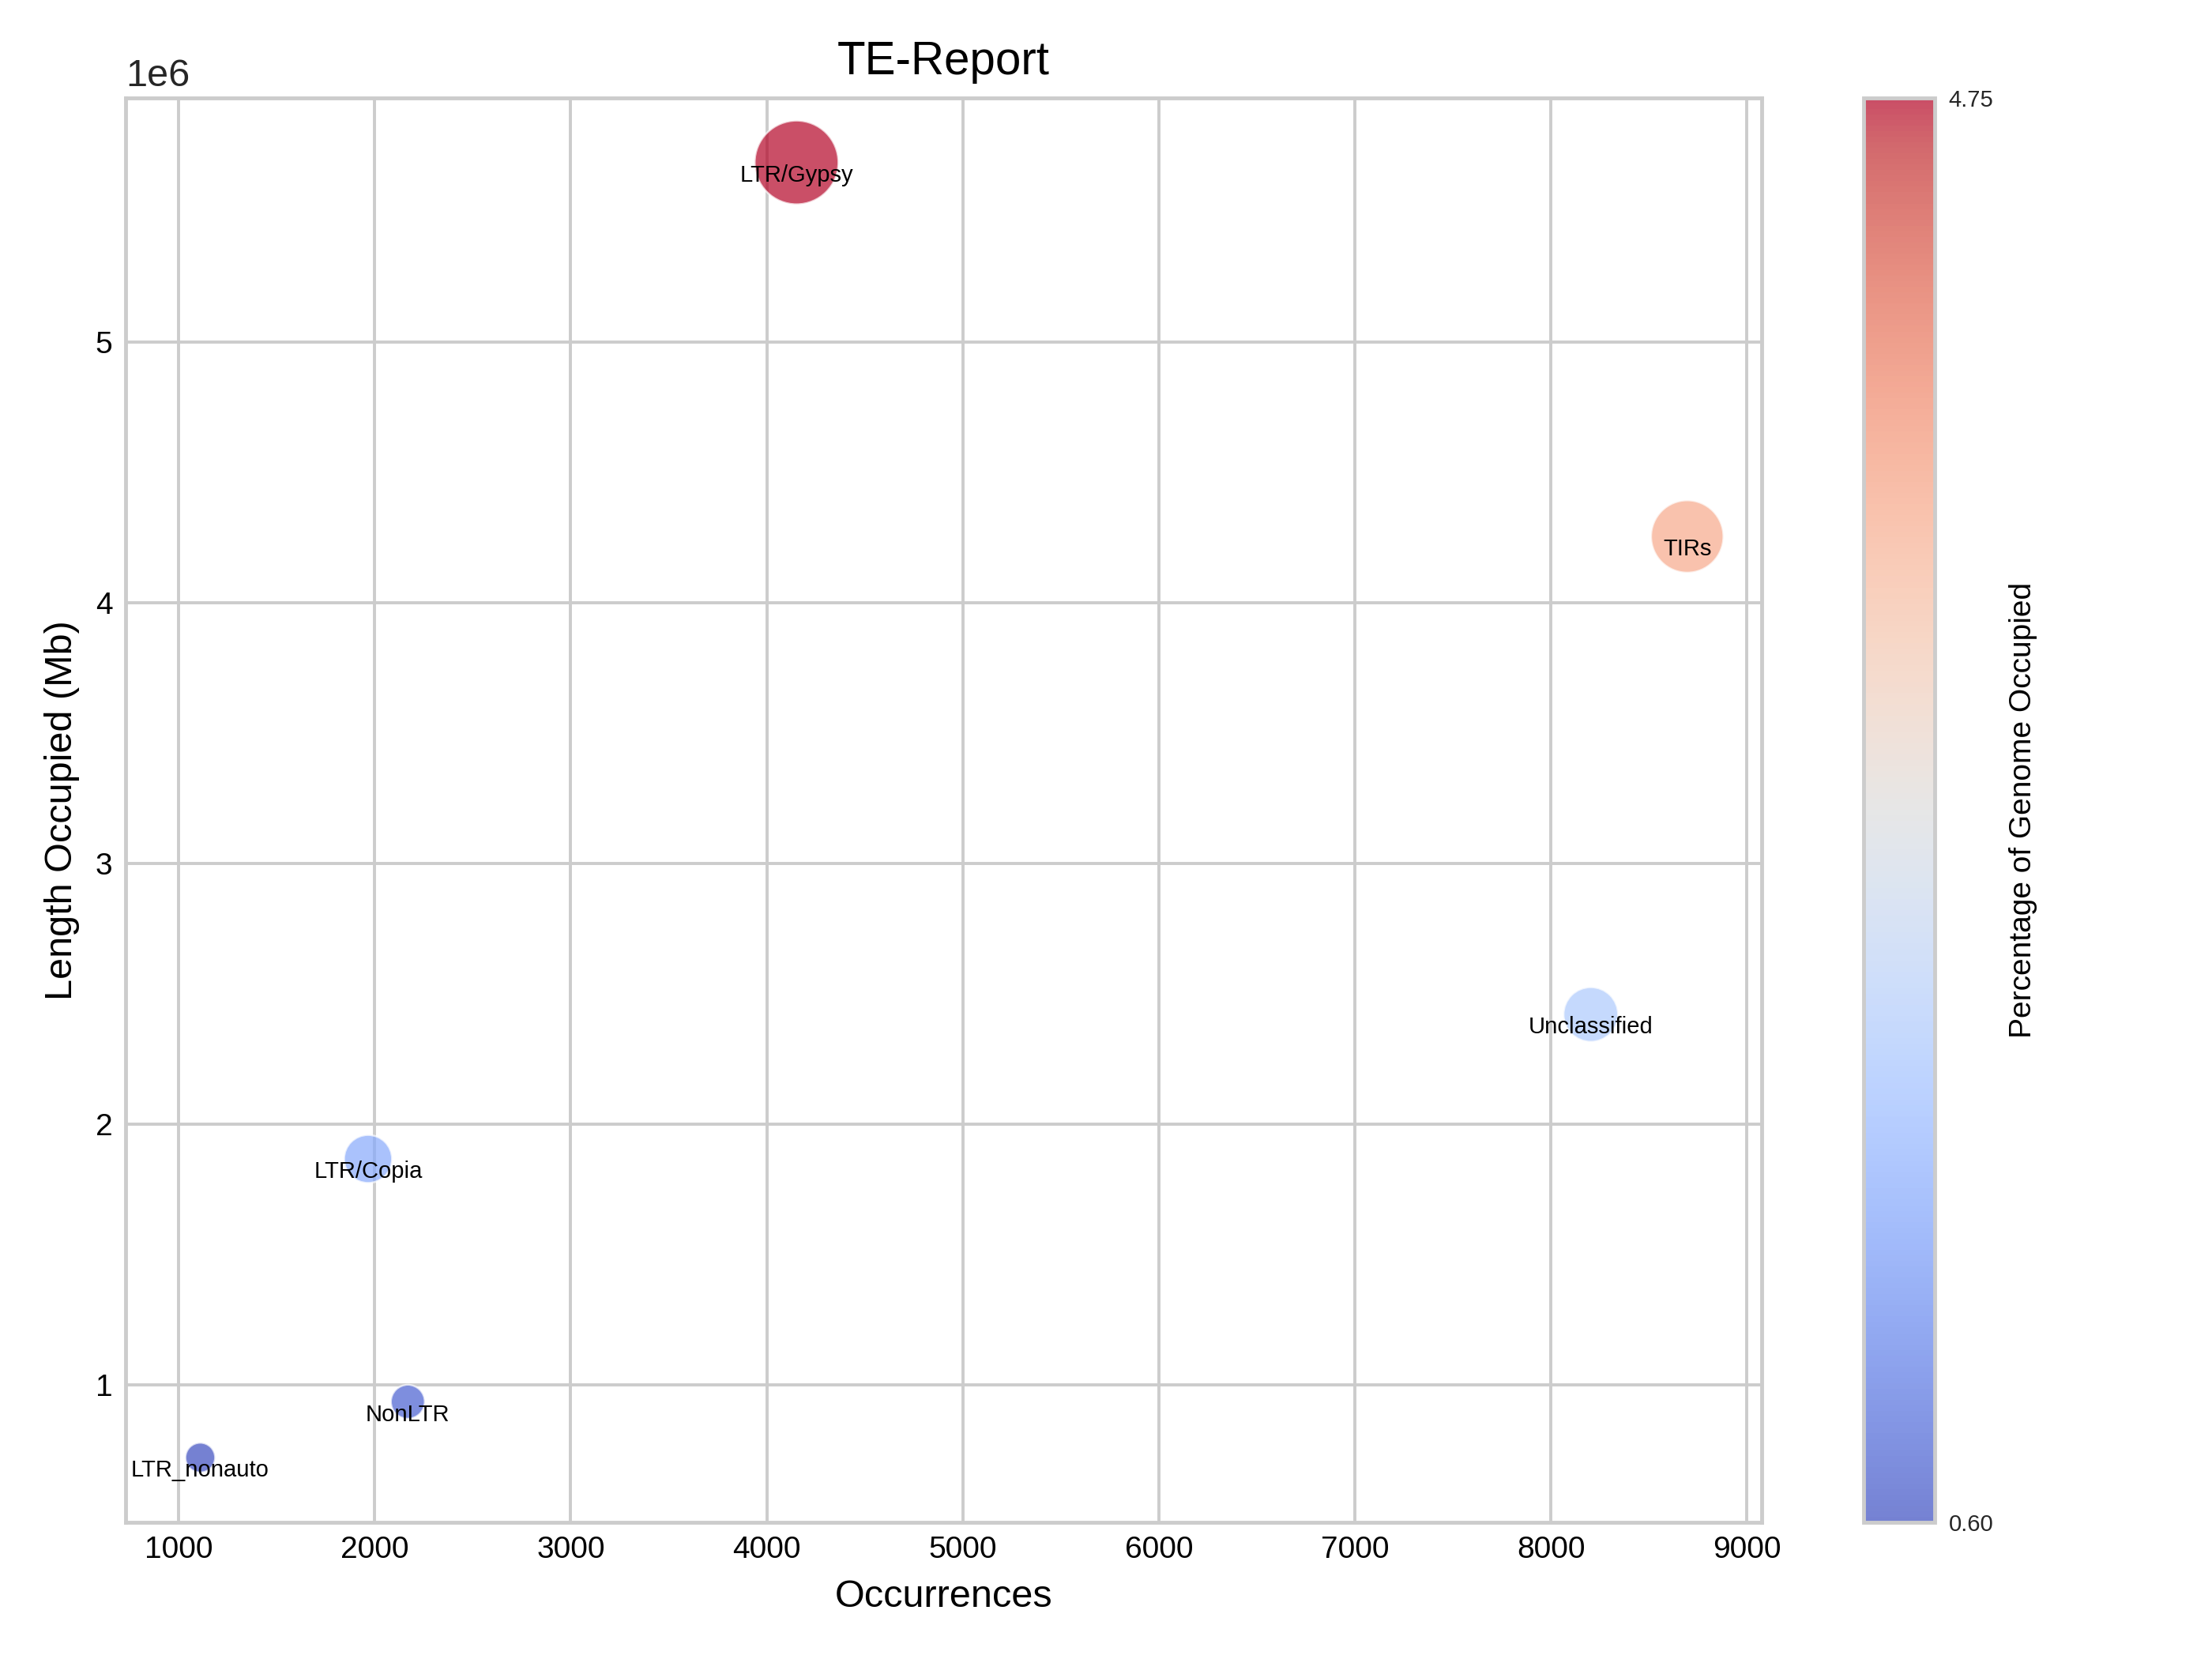
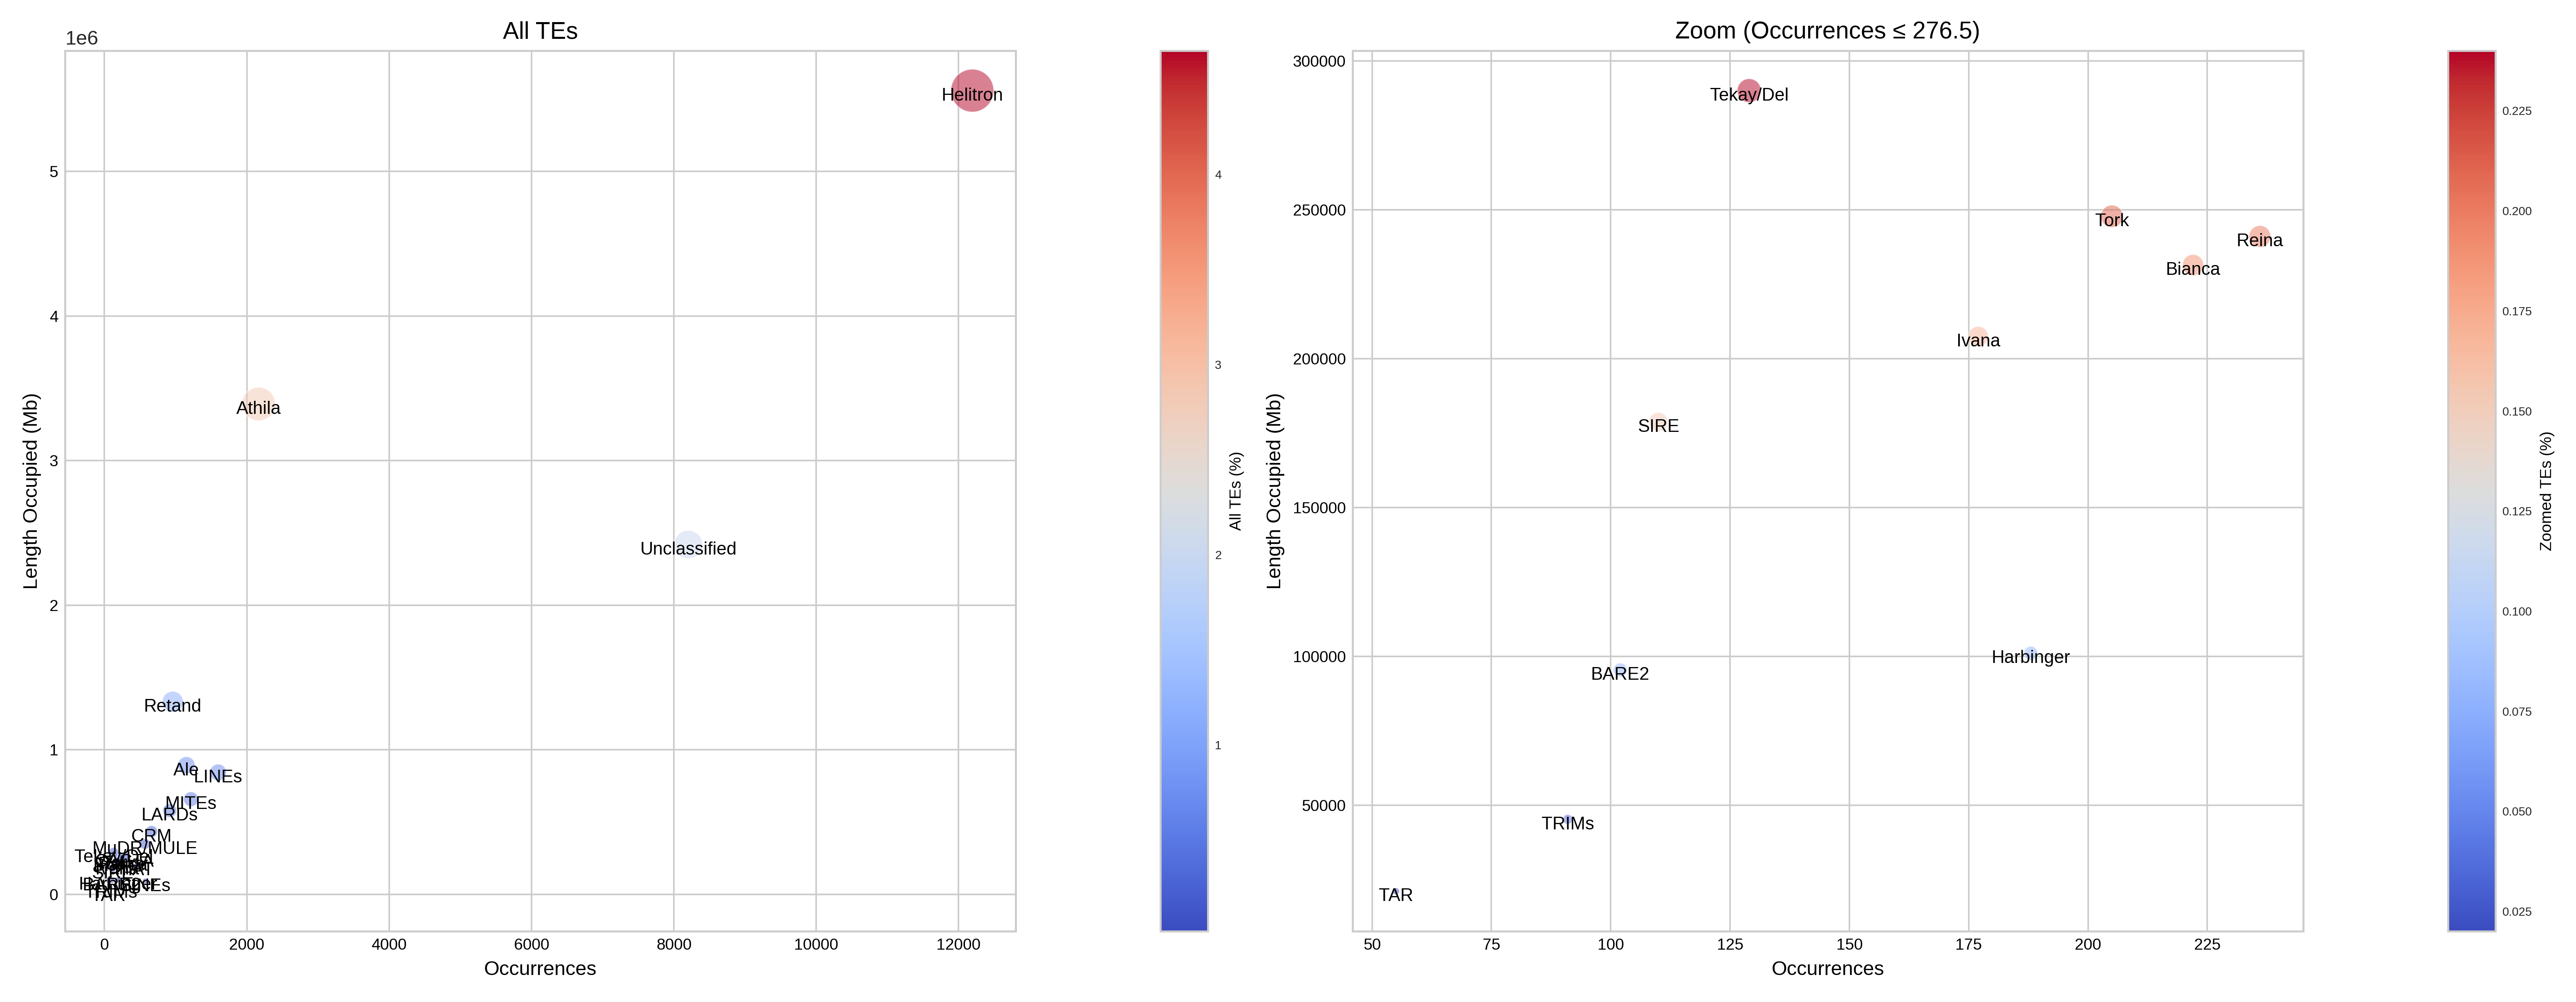
Report
This section presents a table that categorises transposable elements hierarchically by order, superfamily and autonomy, along with the metrics of base pairs, size and percentage. This data is illustrated using bar charts and bubble charts.
| Simplified reporting of TE levels |
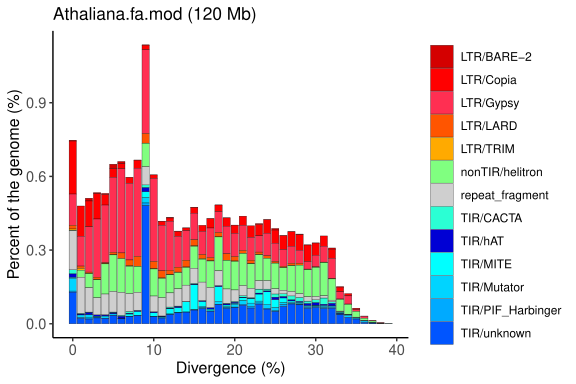
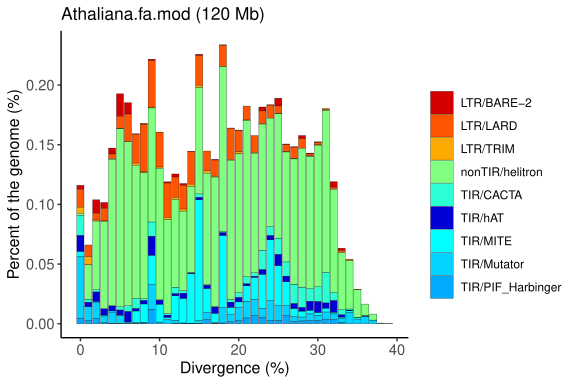
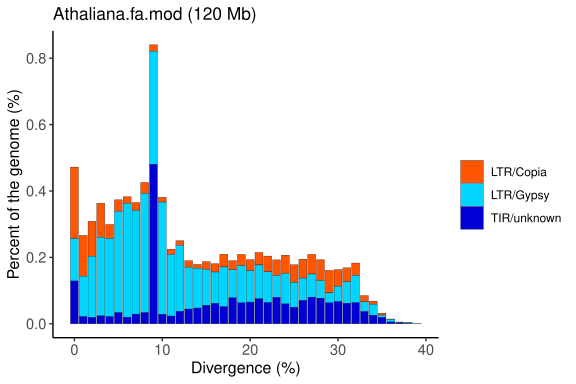
Repeat Landscape Graphs
The repeat landscape graph provides a coherent and easily understandable inference of the relative ages of each repetitive element identified in a specific genome. This analysis is based on the genetic distance calculation proposed by Kimura, which estimates the time elapsed since duplication or insertion events of these elements.
By applying Kimura’s calculation, the graph distinguishes older elements (with greater accumulated divergence) from more recent ones (with lower divergence), offering valuable insights into the evolutionary dynamics and genomic history of the organism under study.
By applying Kimura’s calculation, the graph distinguishes older elements (with greater accumulated divergence) from more recent ones (with lower divergence), offering valuable insights into the evolutionary dynamics and genomic history of the organism under study.
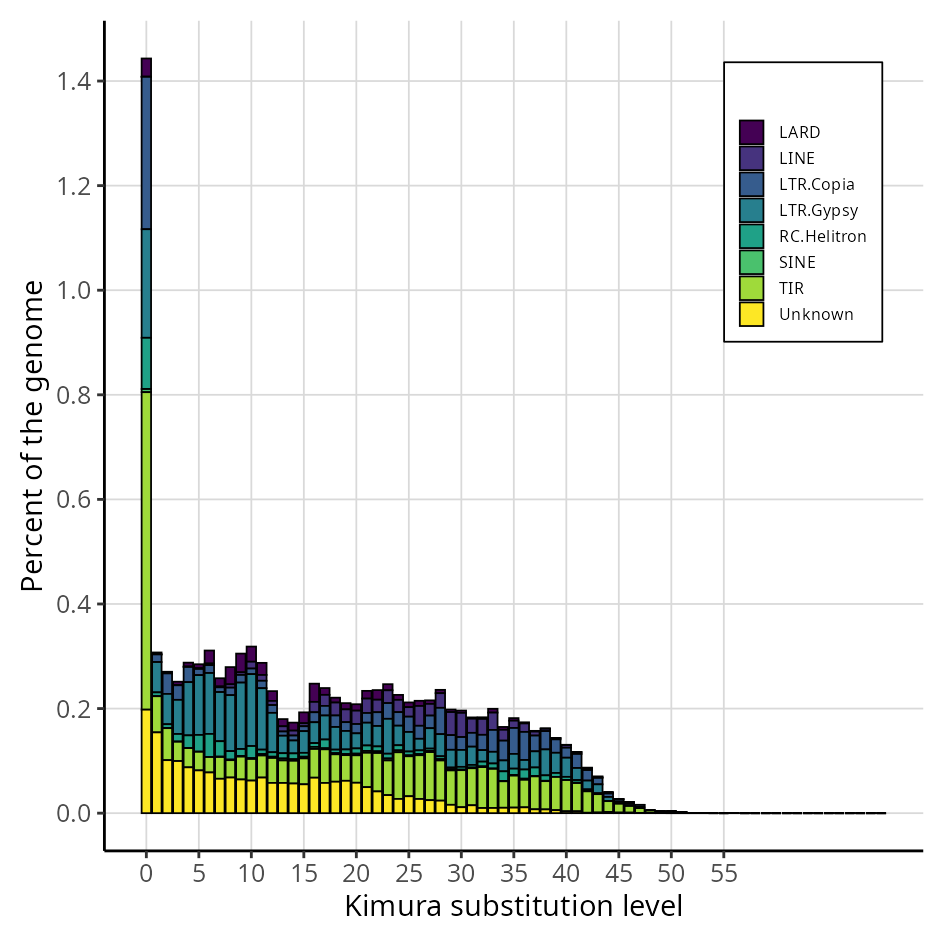
Graph generated by the original EDTA pipeline (Ou et al., 2019; PMID: 31843001), adapted to reflect the organisation and classification of transposable elements (TEs). The plot shows the genomic proportion of each TE category across divergence levels, allowing the visualisation of the age distribution and relative abundance of different TE superfamilies.
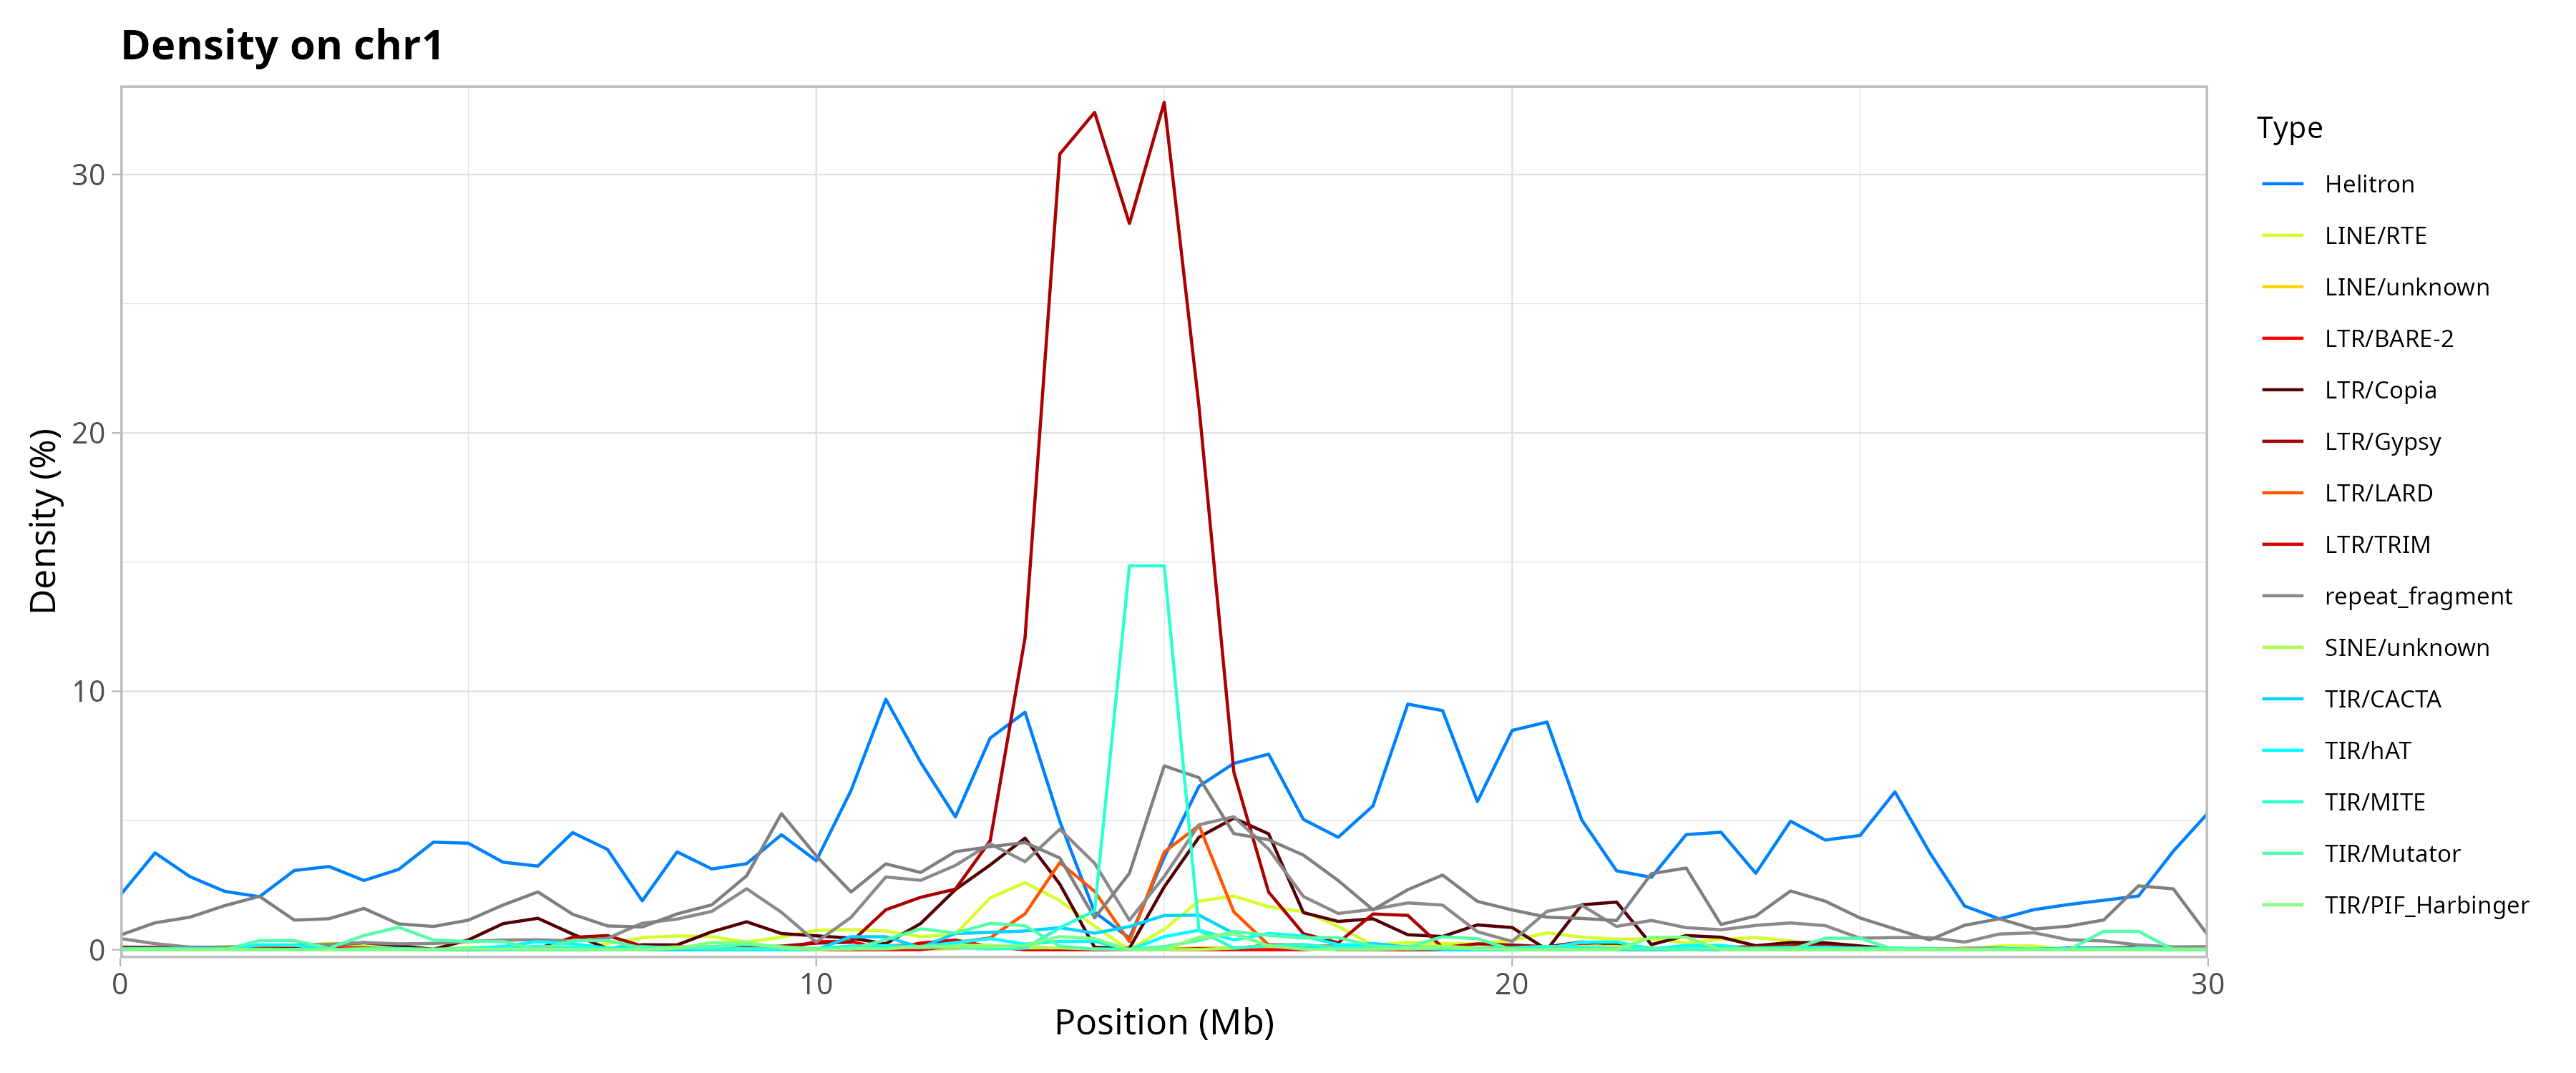
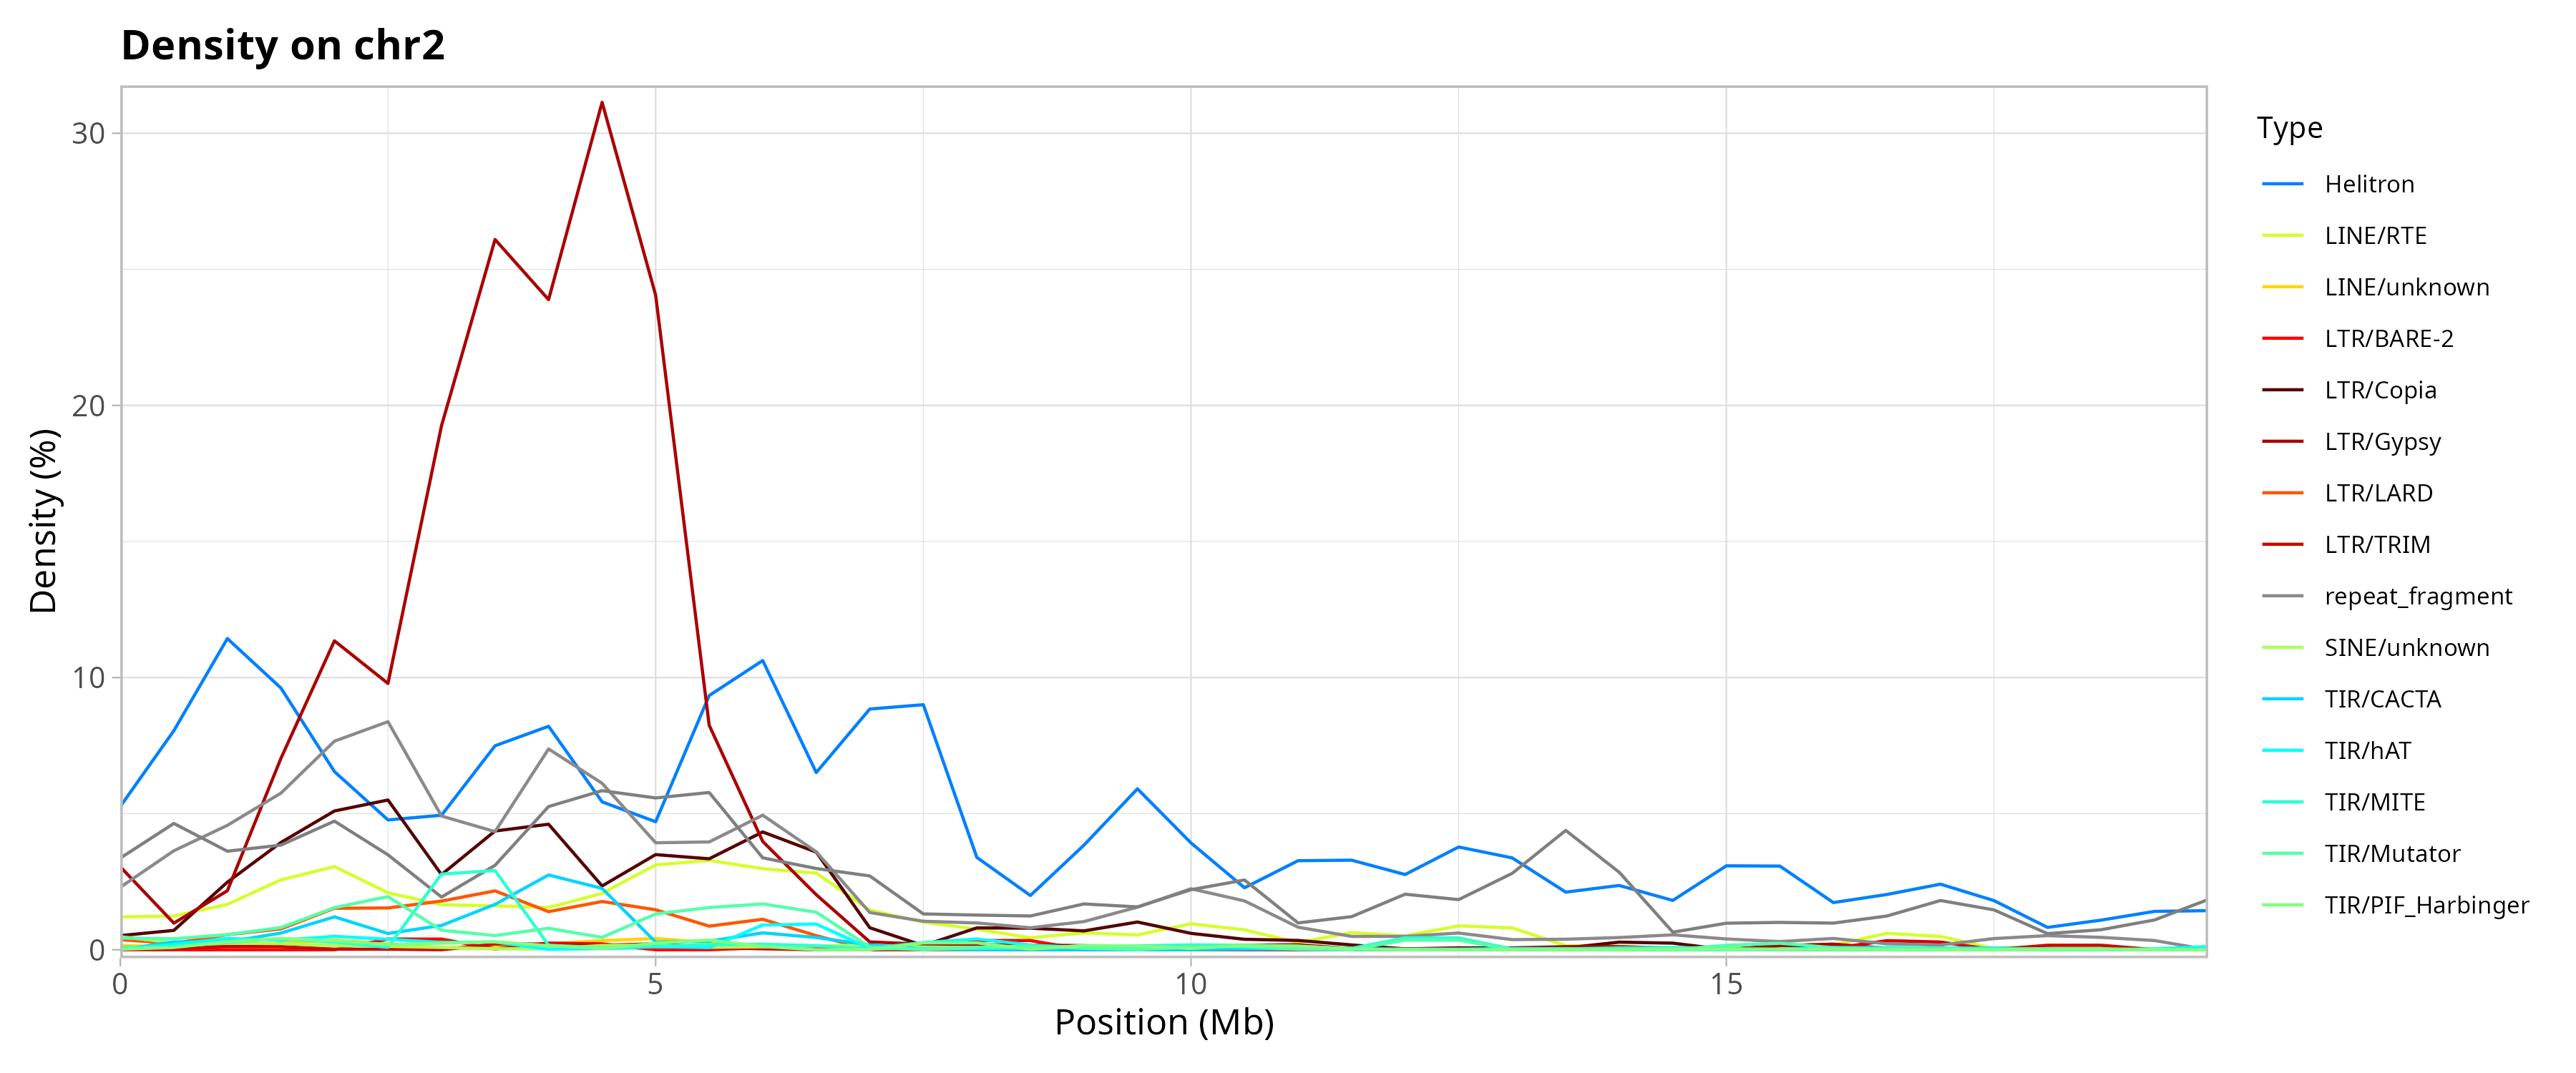
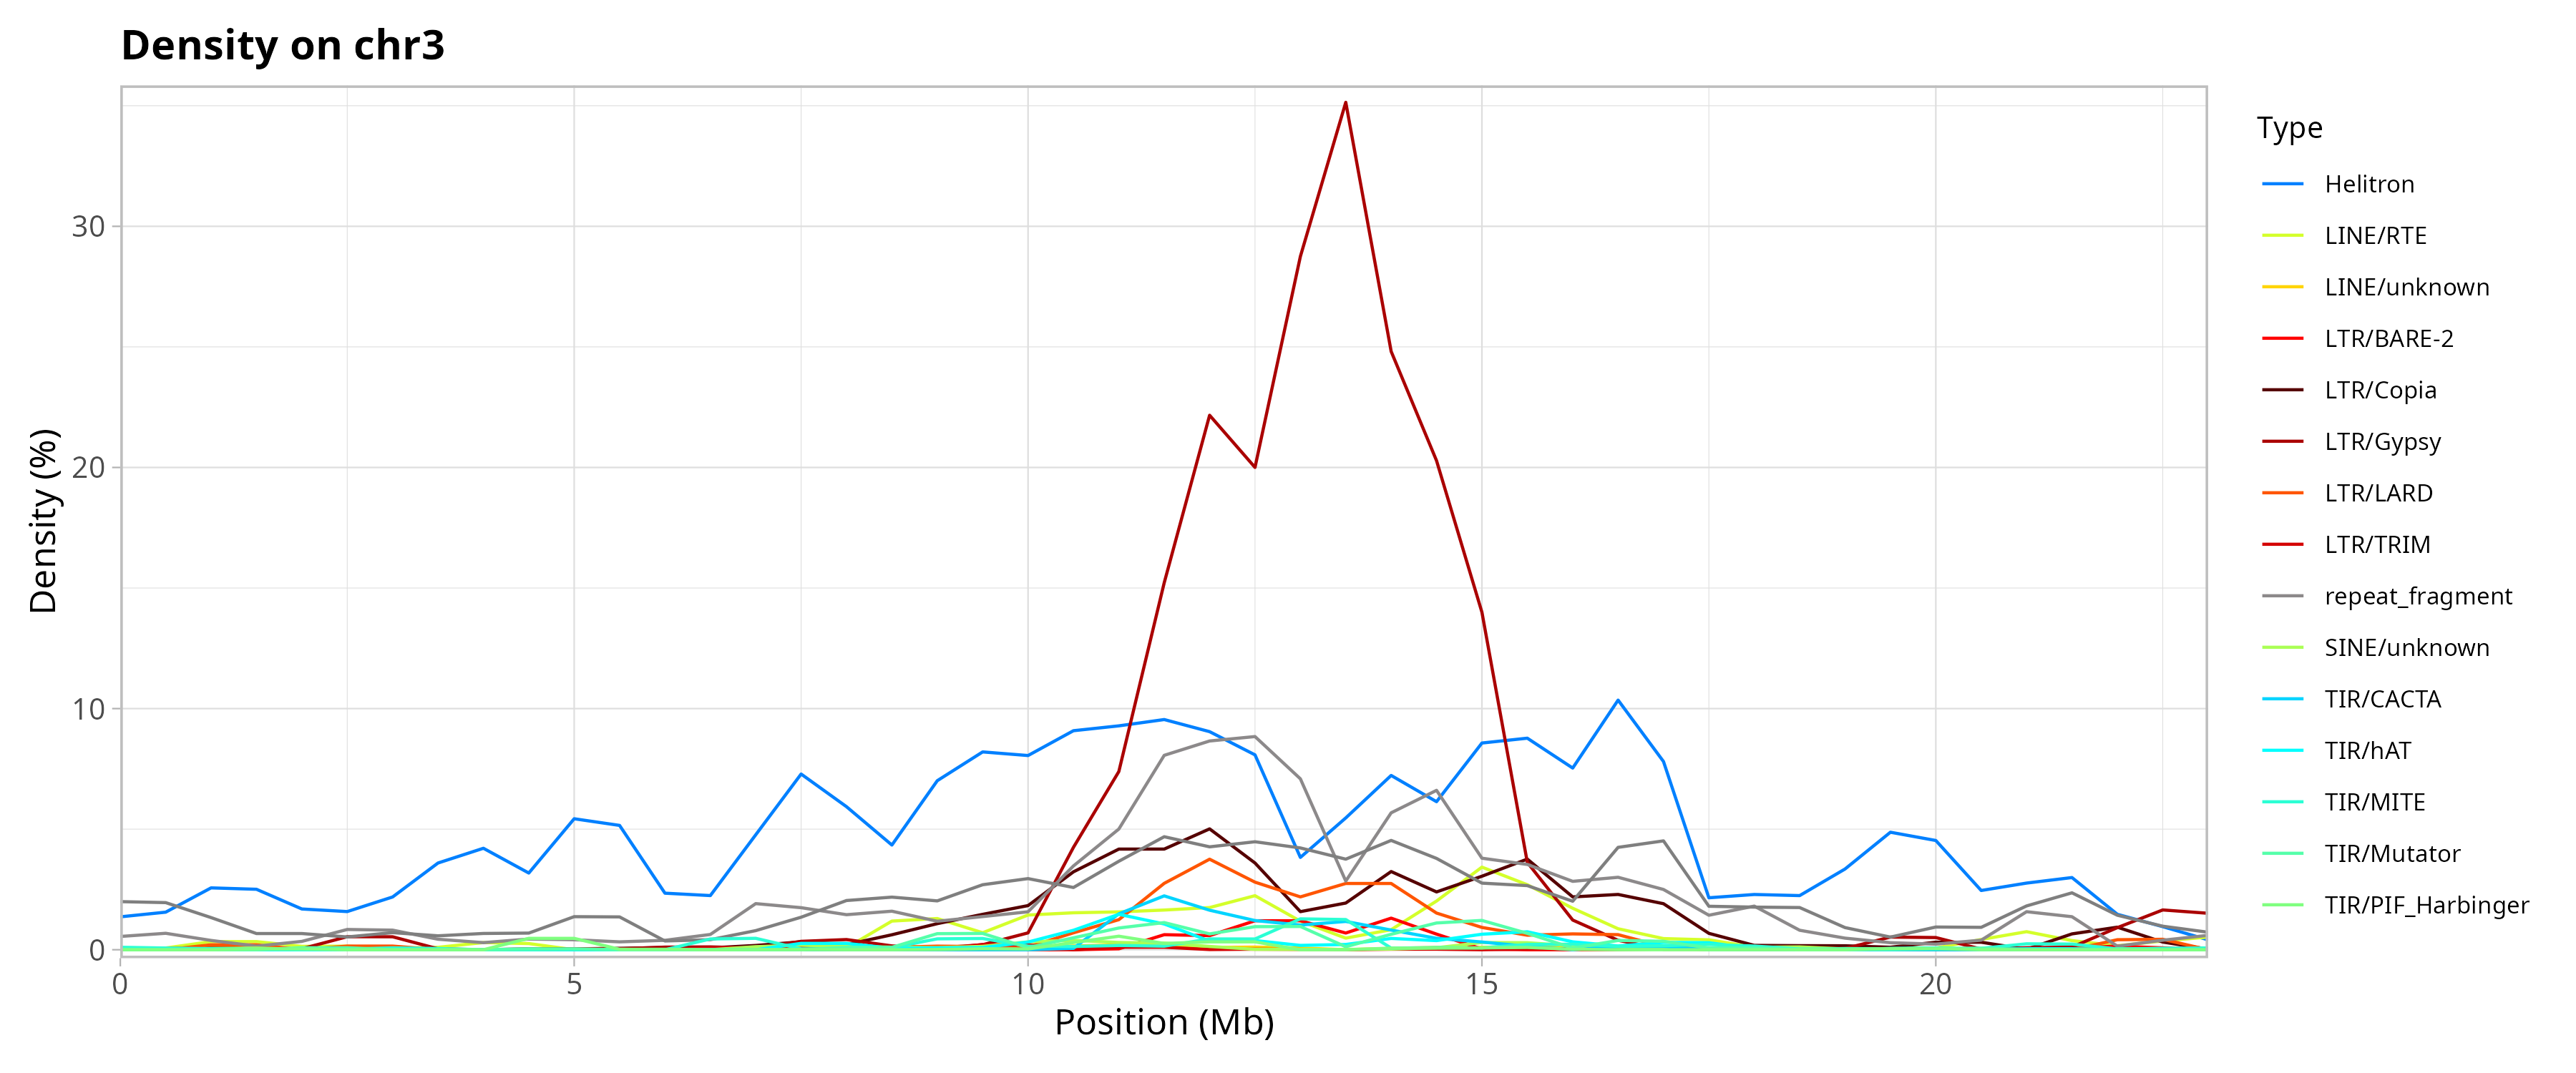
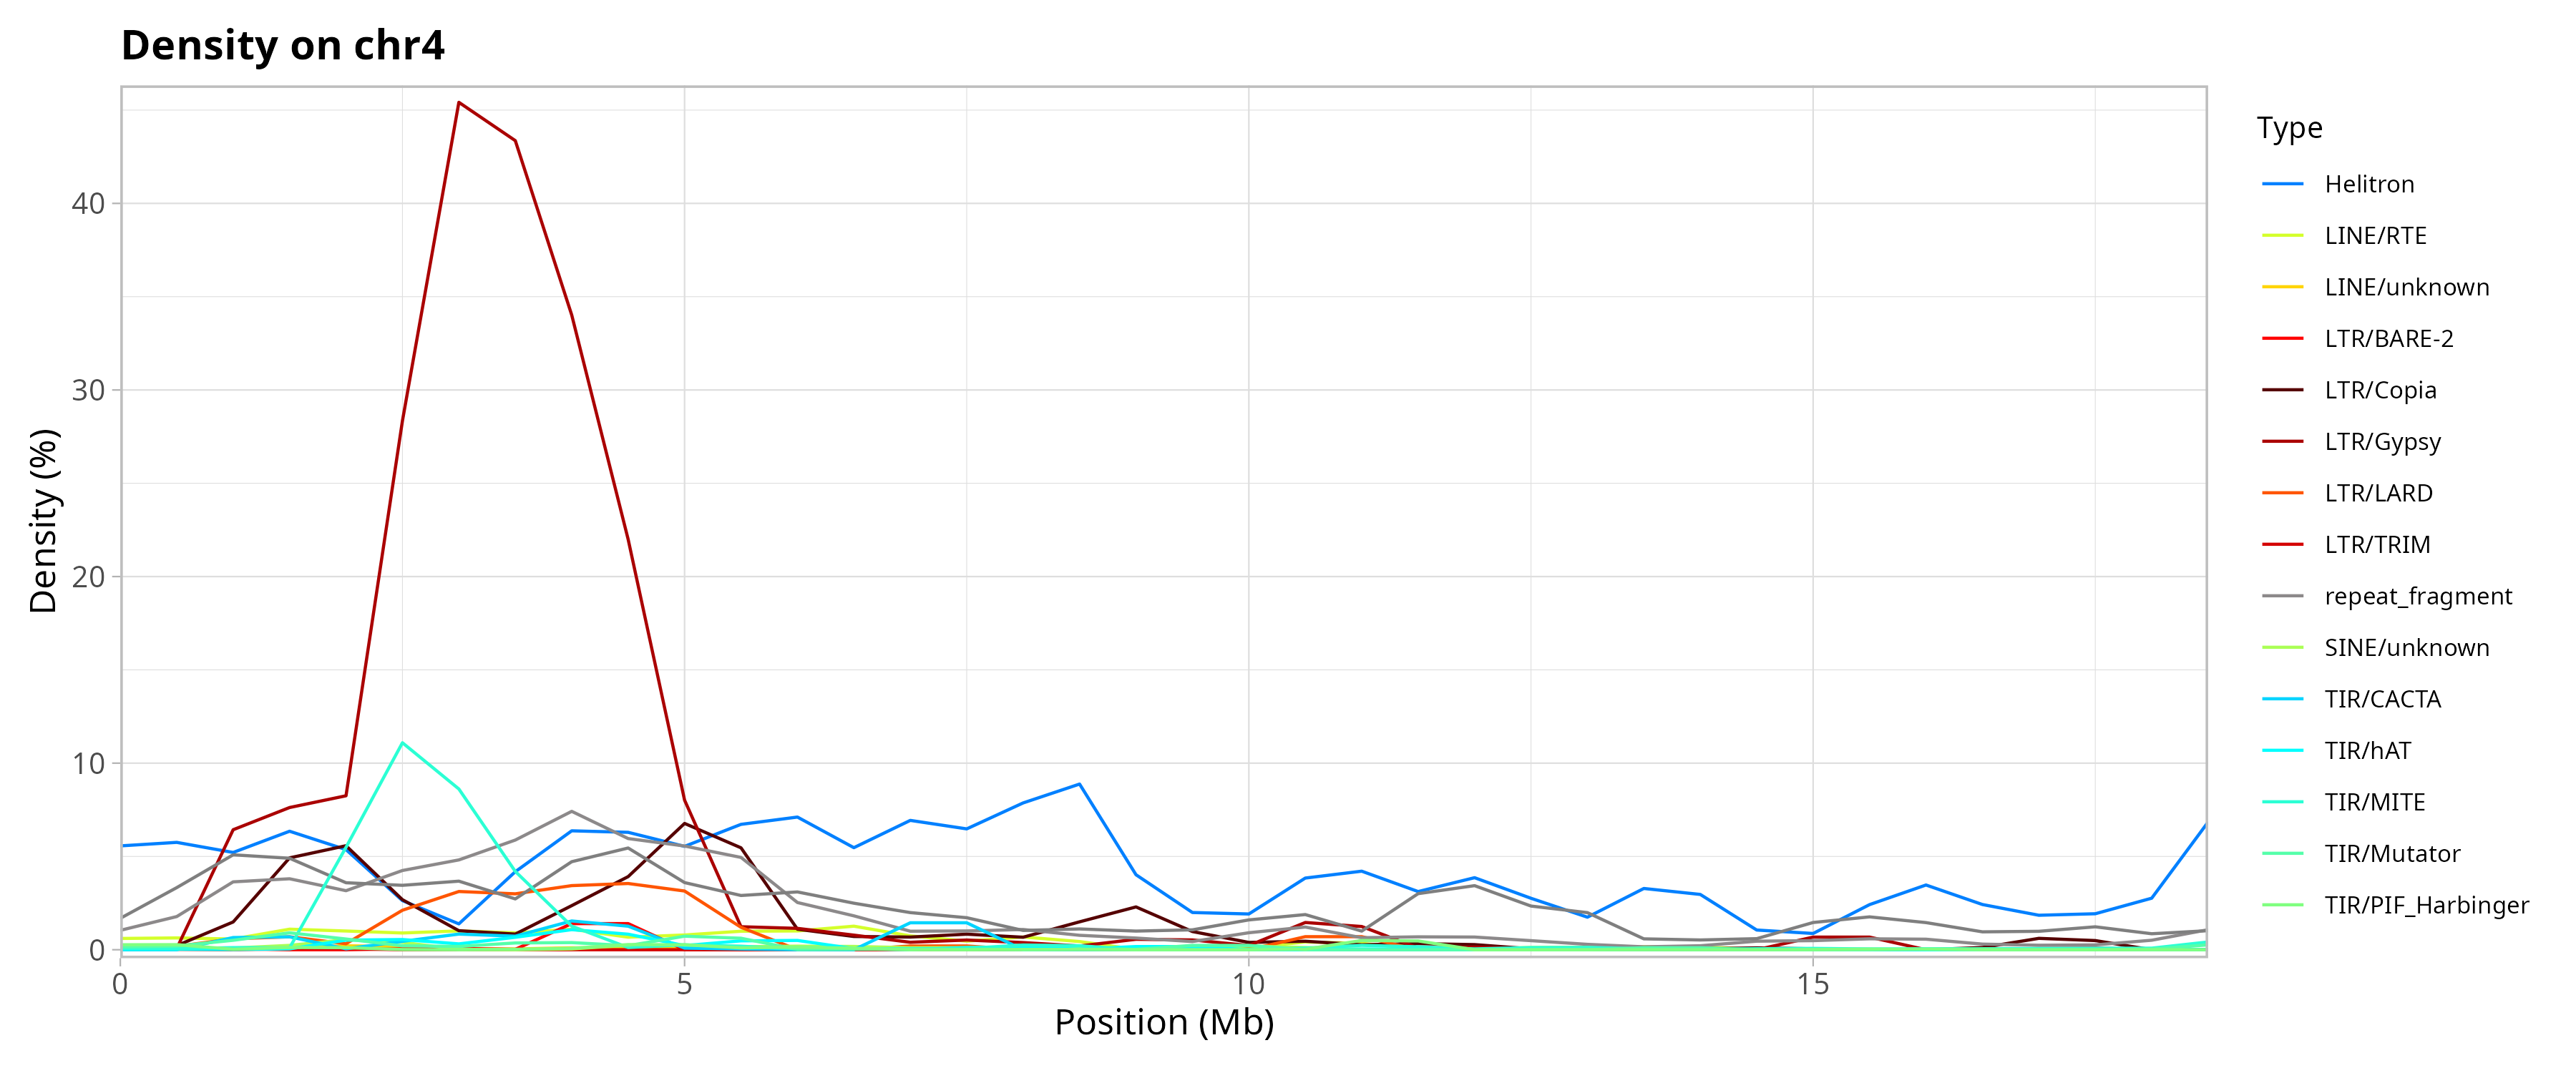
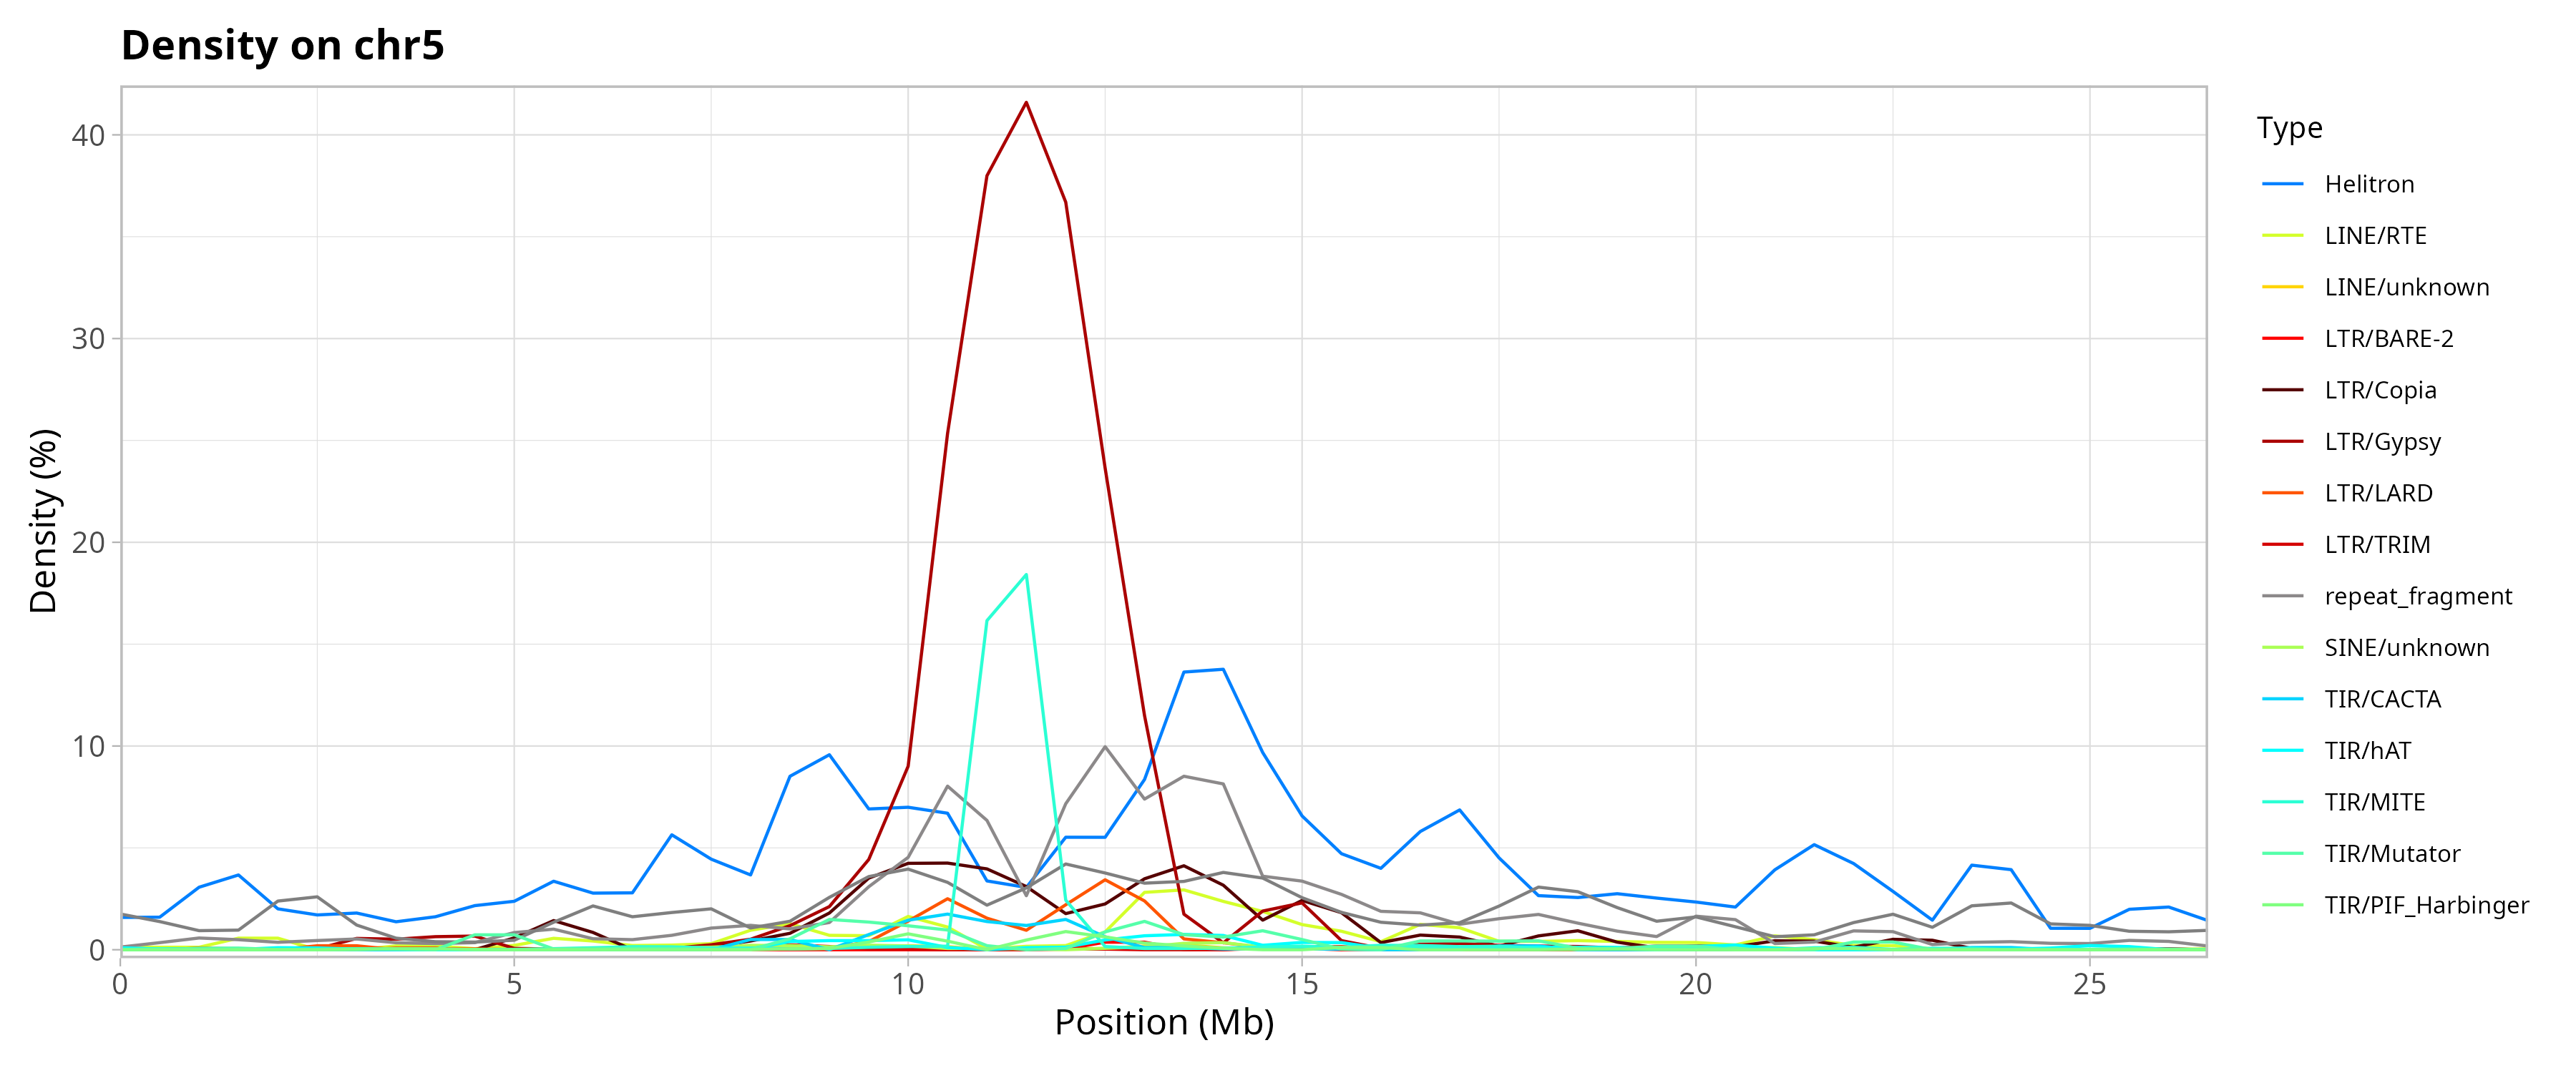
Genomic Distribution of TEs by Chromosome
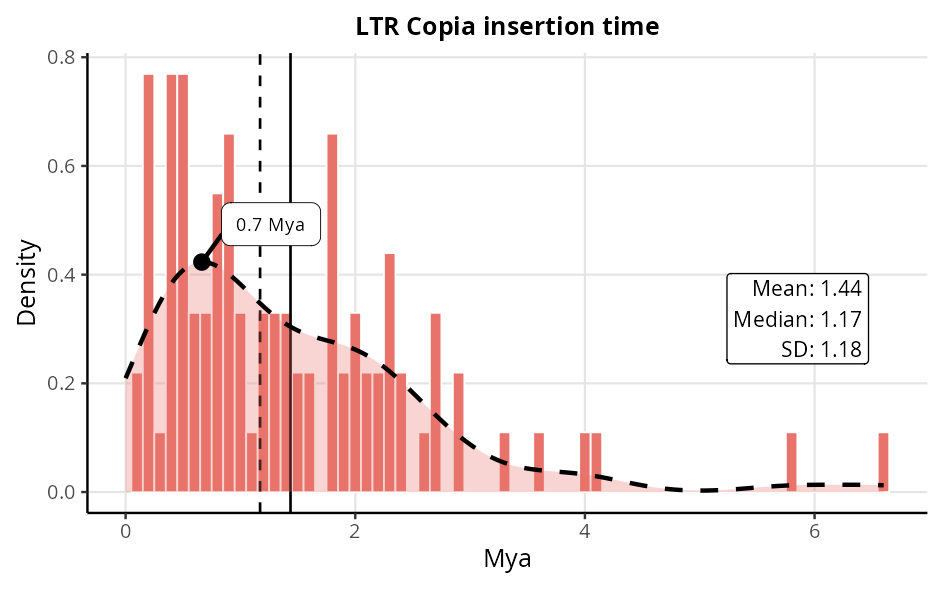
LTR SuperFamily
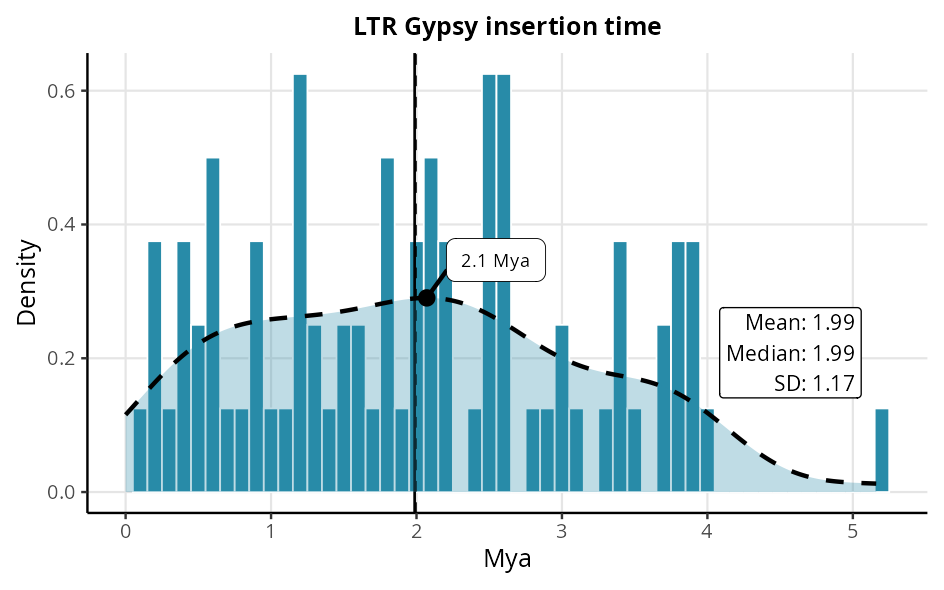
The histogram displays the age distribution of LTR elements identified in the genome. The dashed vertical lines indicate the median age, while the horizontal line represents the mean, both expressed in million years (Mya).
This visualisation provides a clear analysis of the dispersion of LTR ages, highlighting the central tendency and temporal variability of these elements.
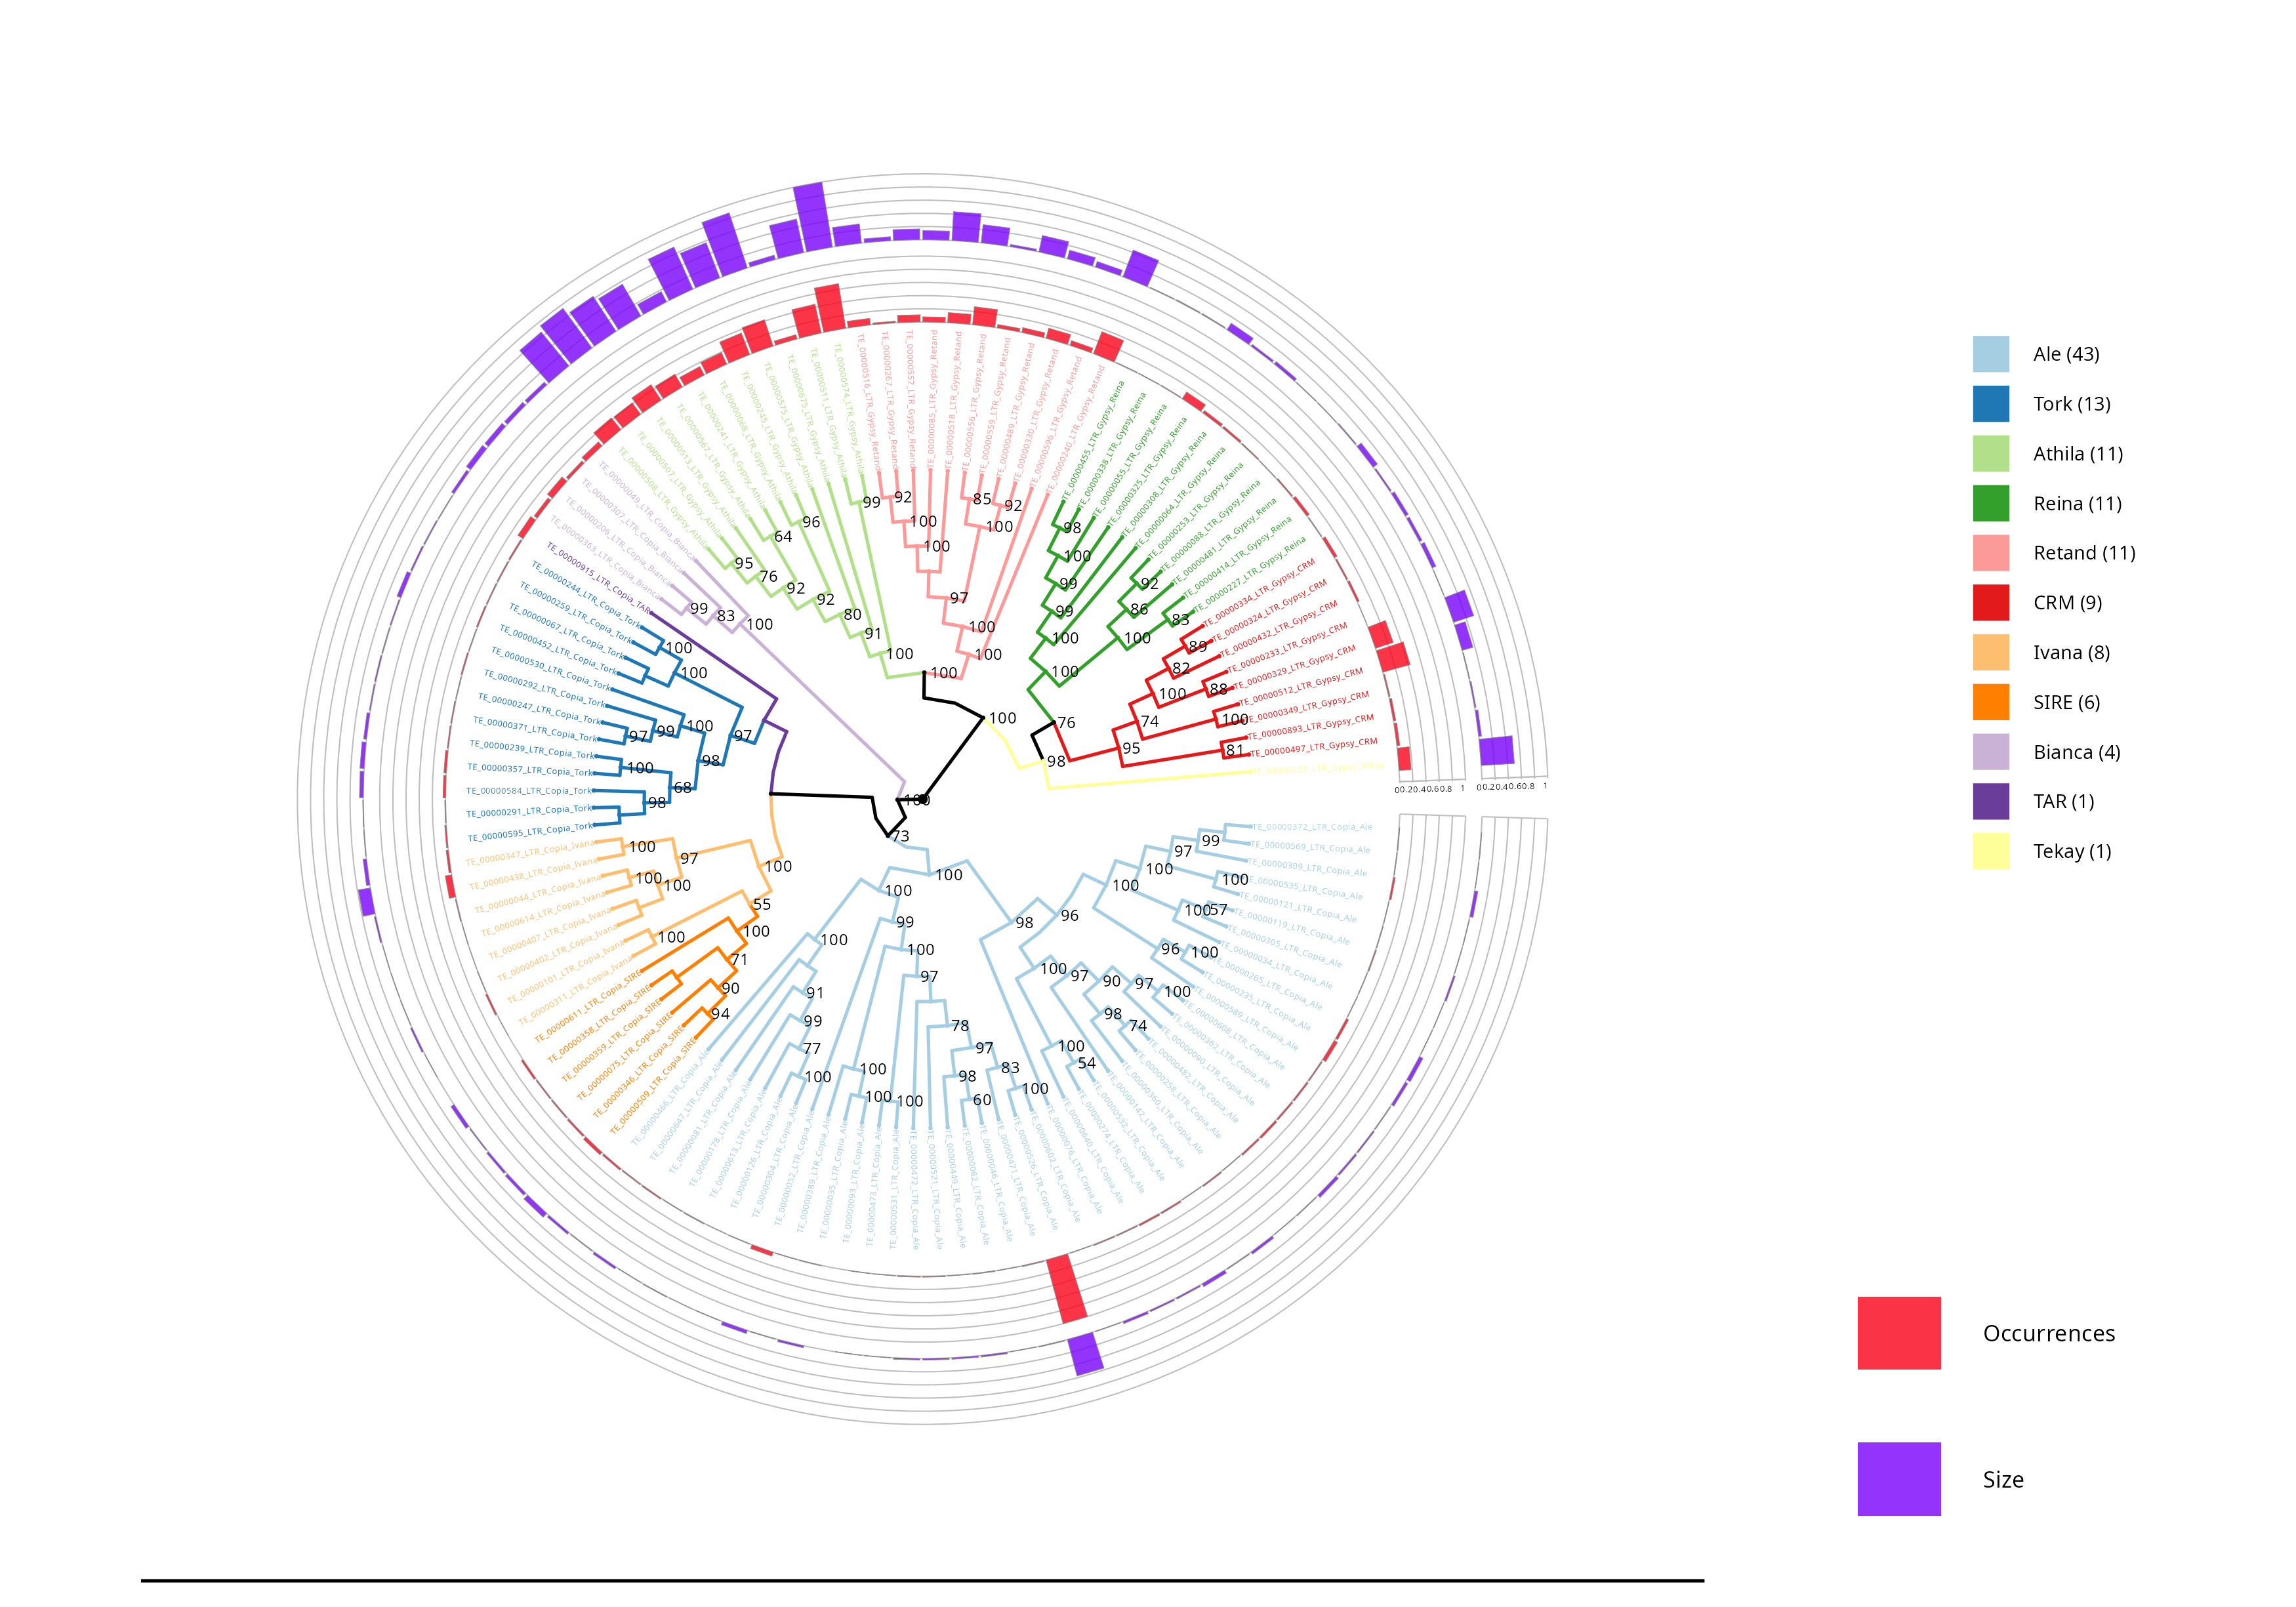
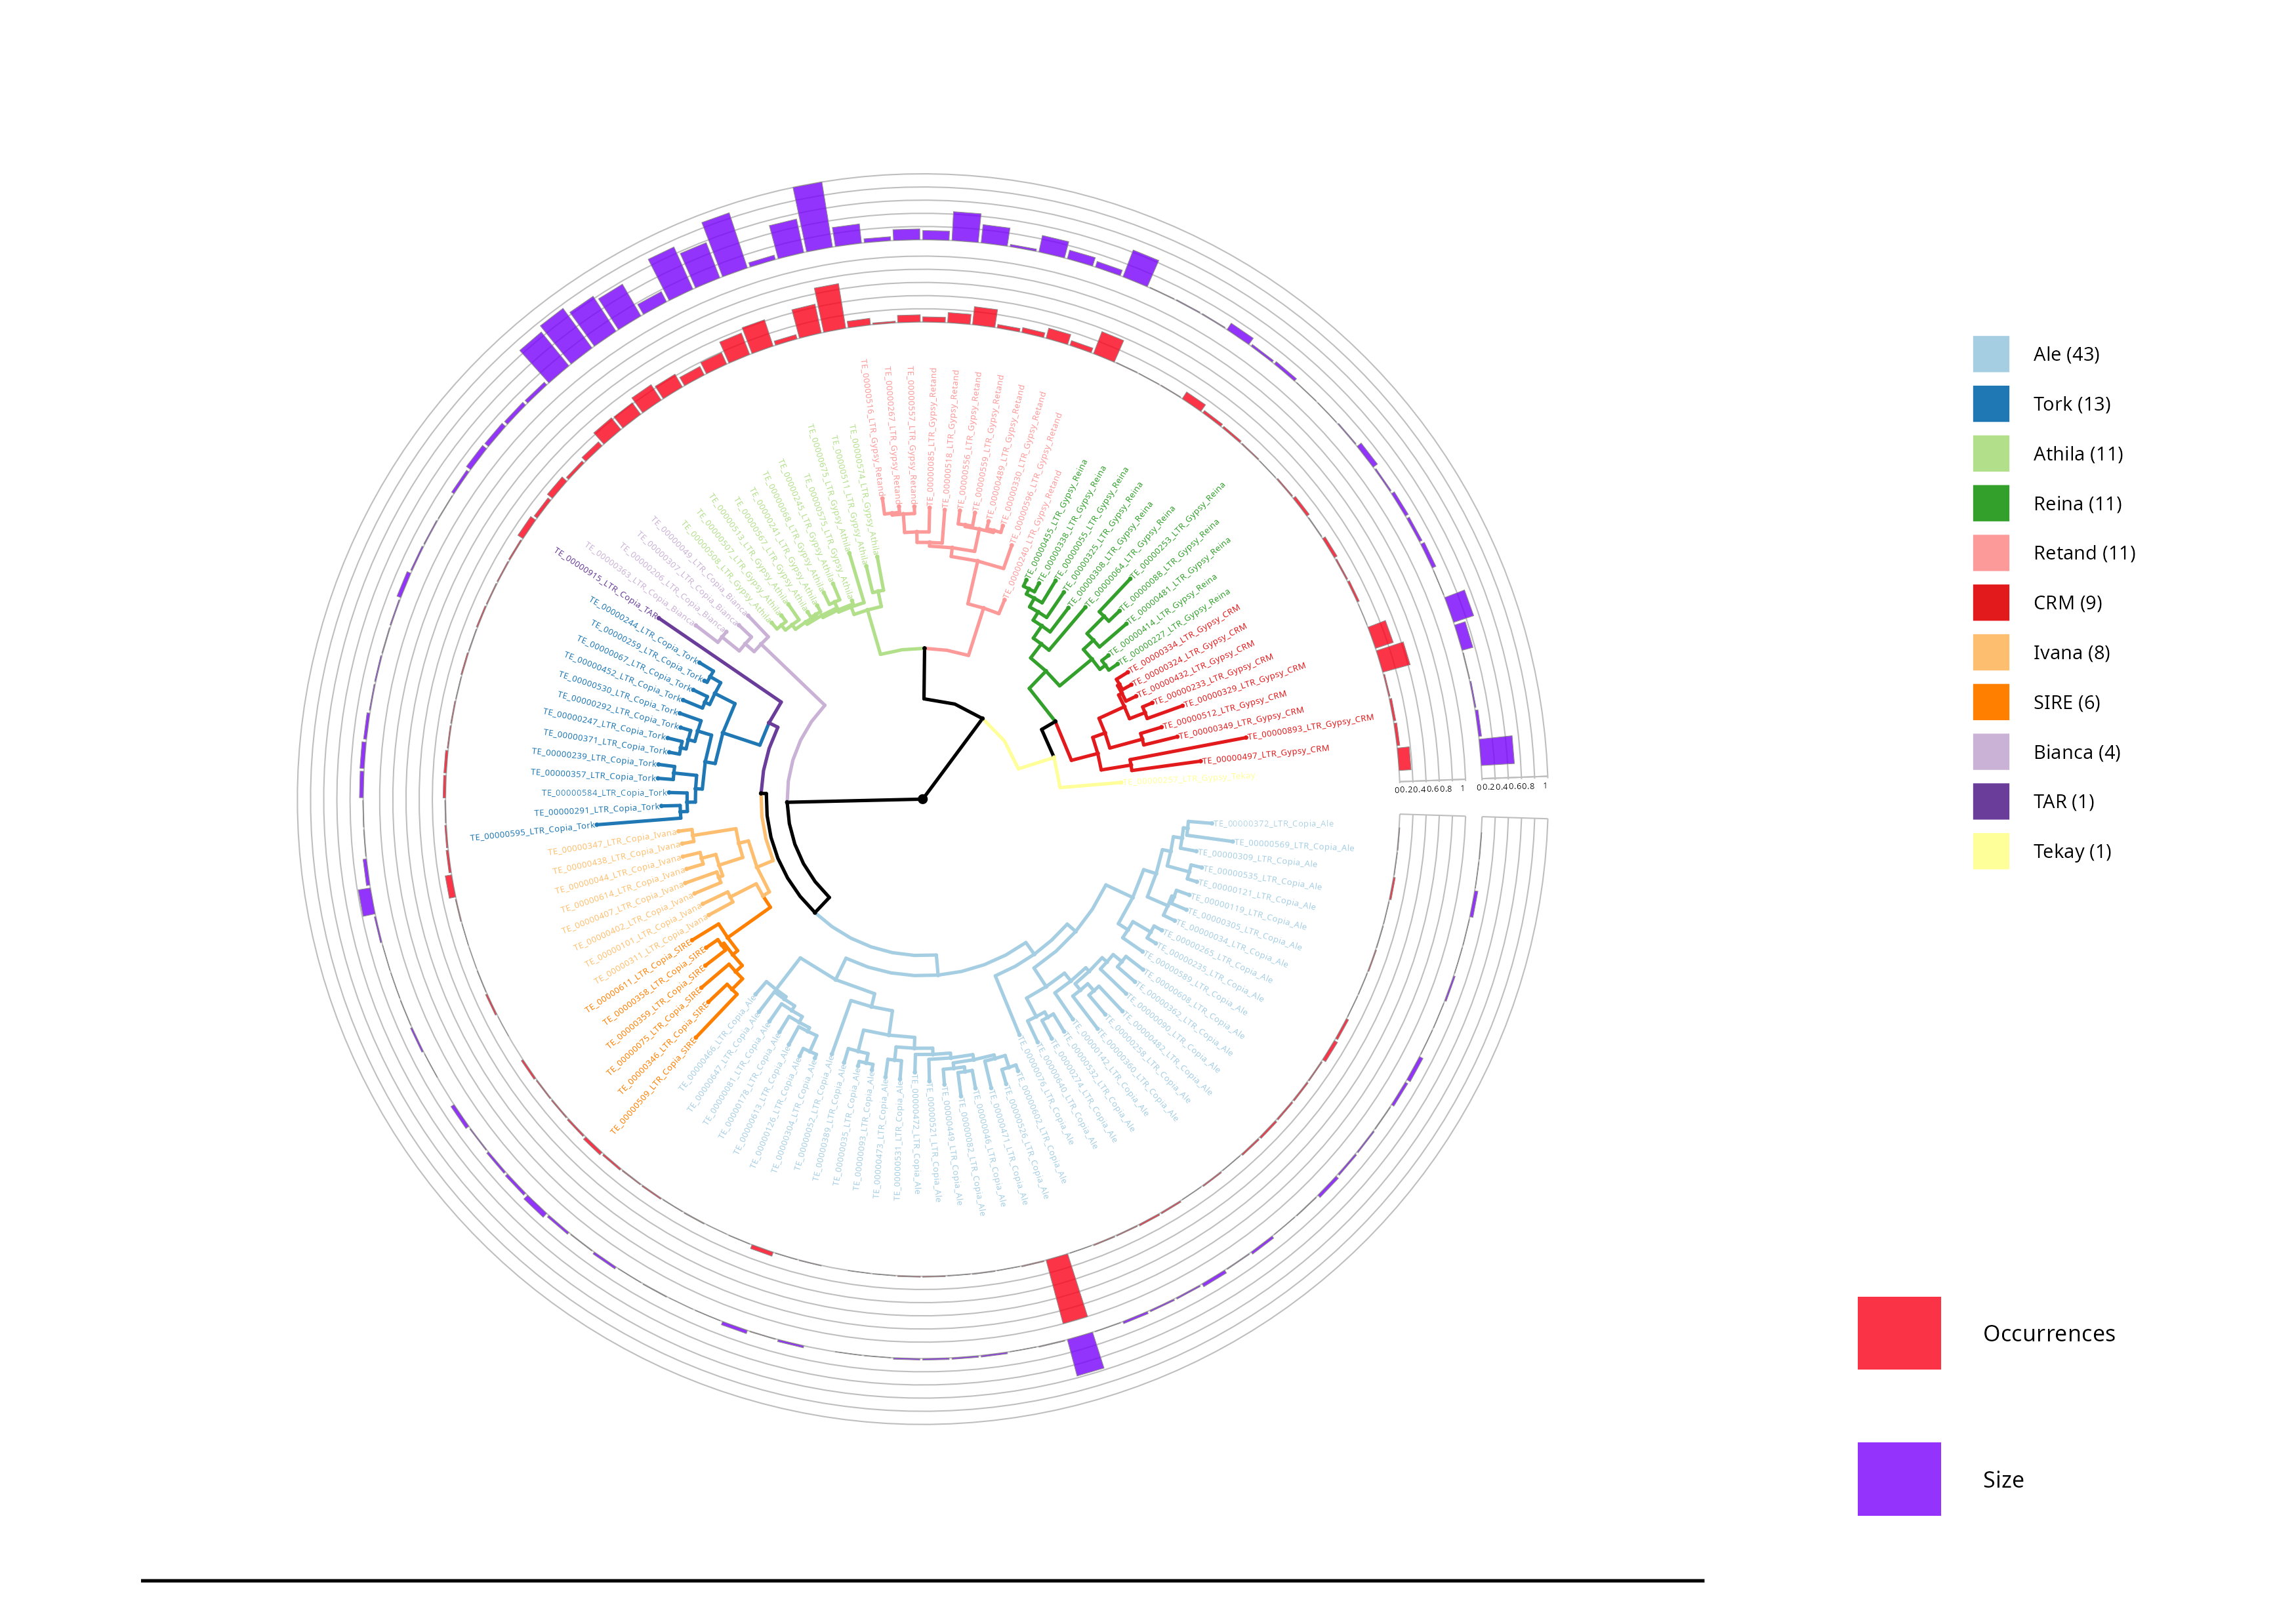
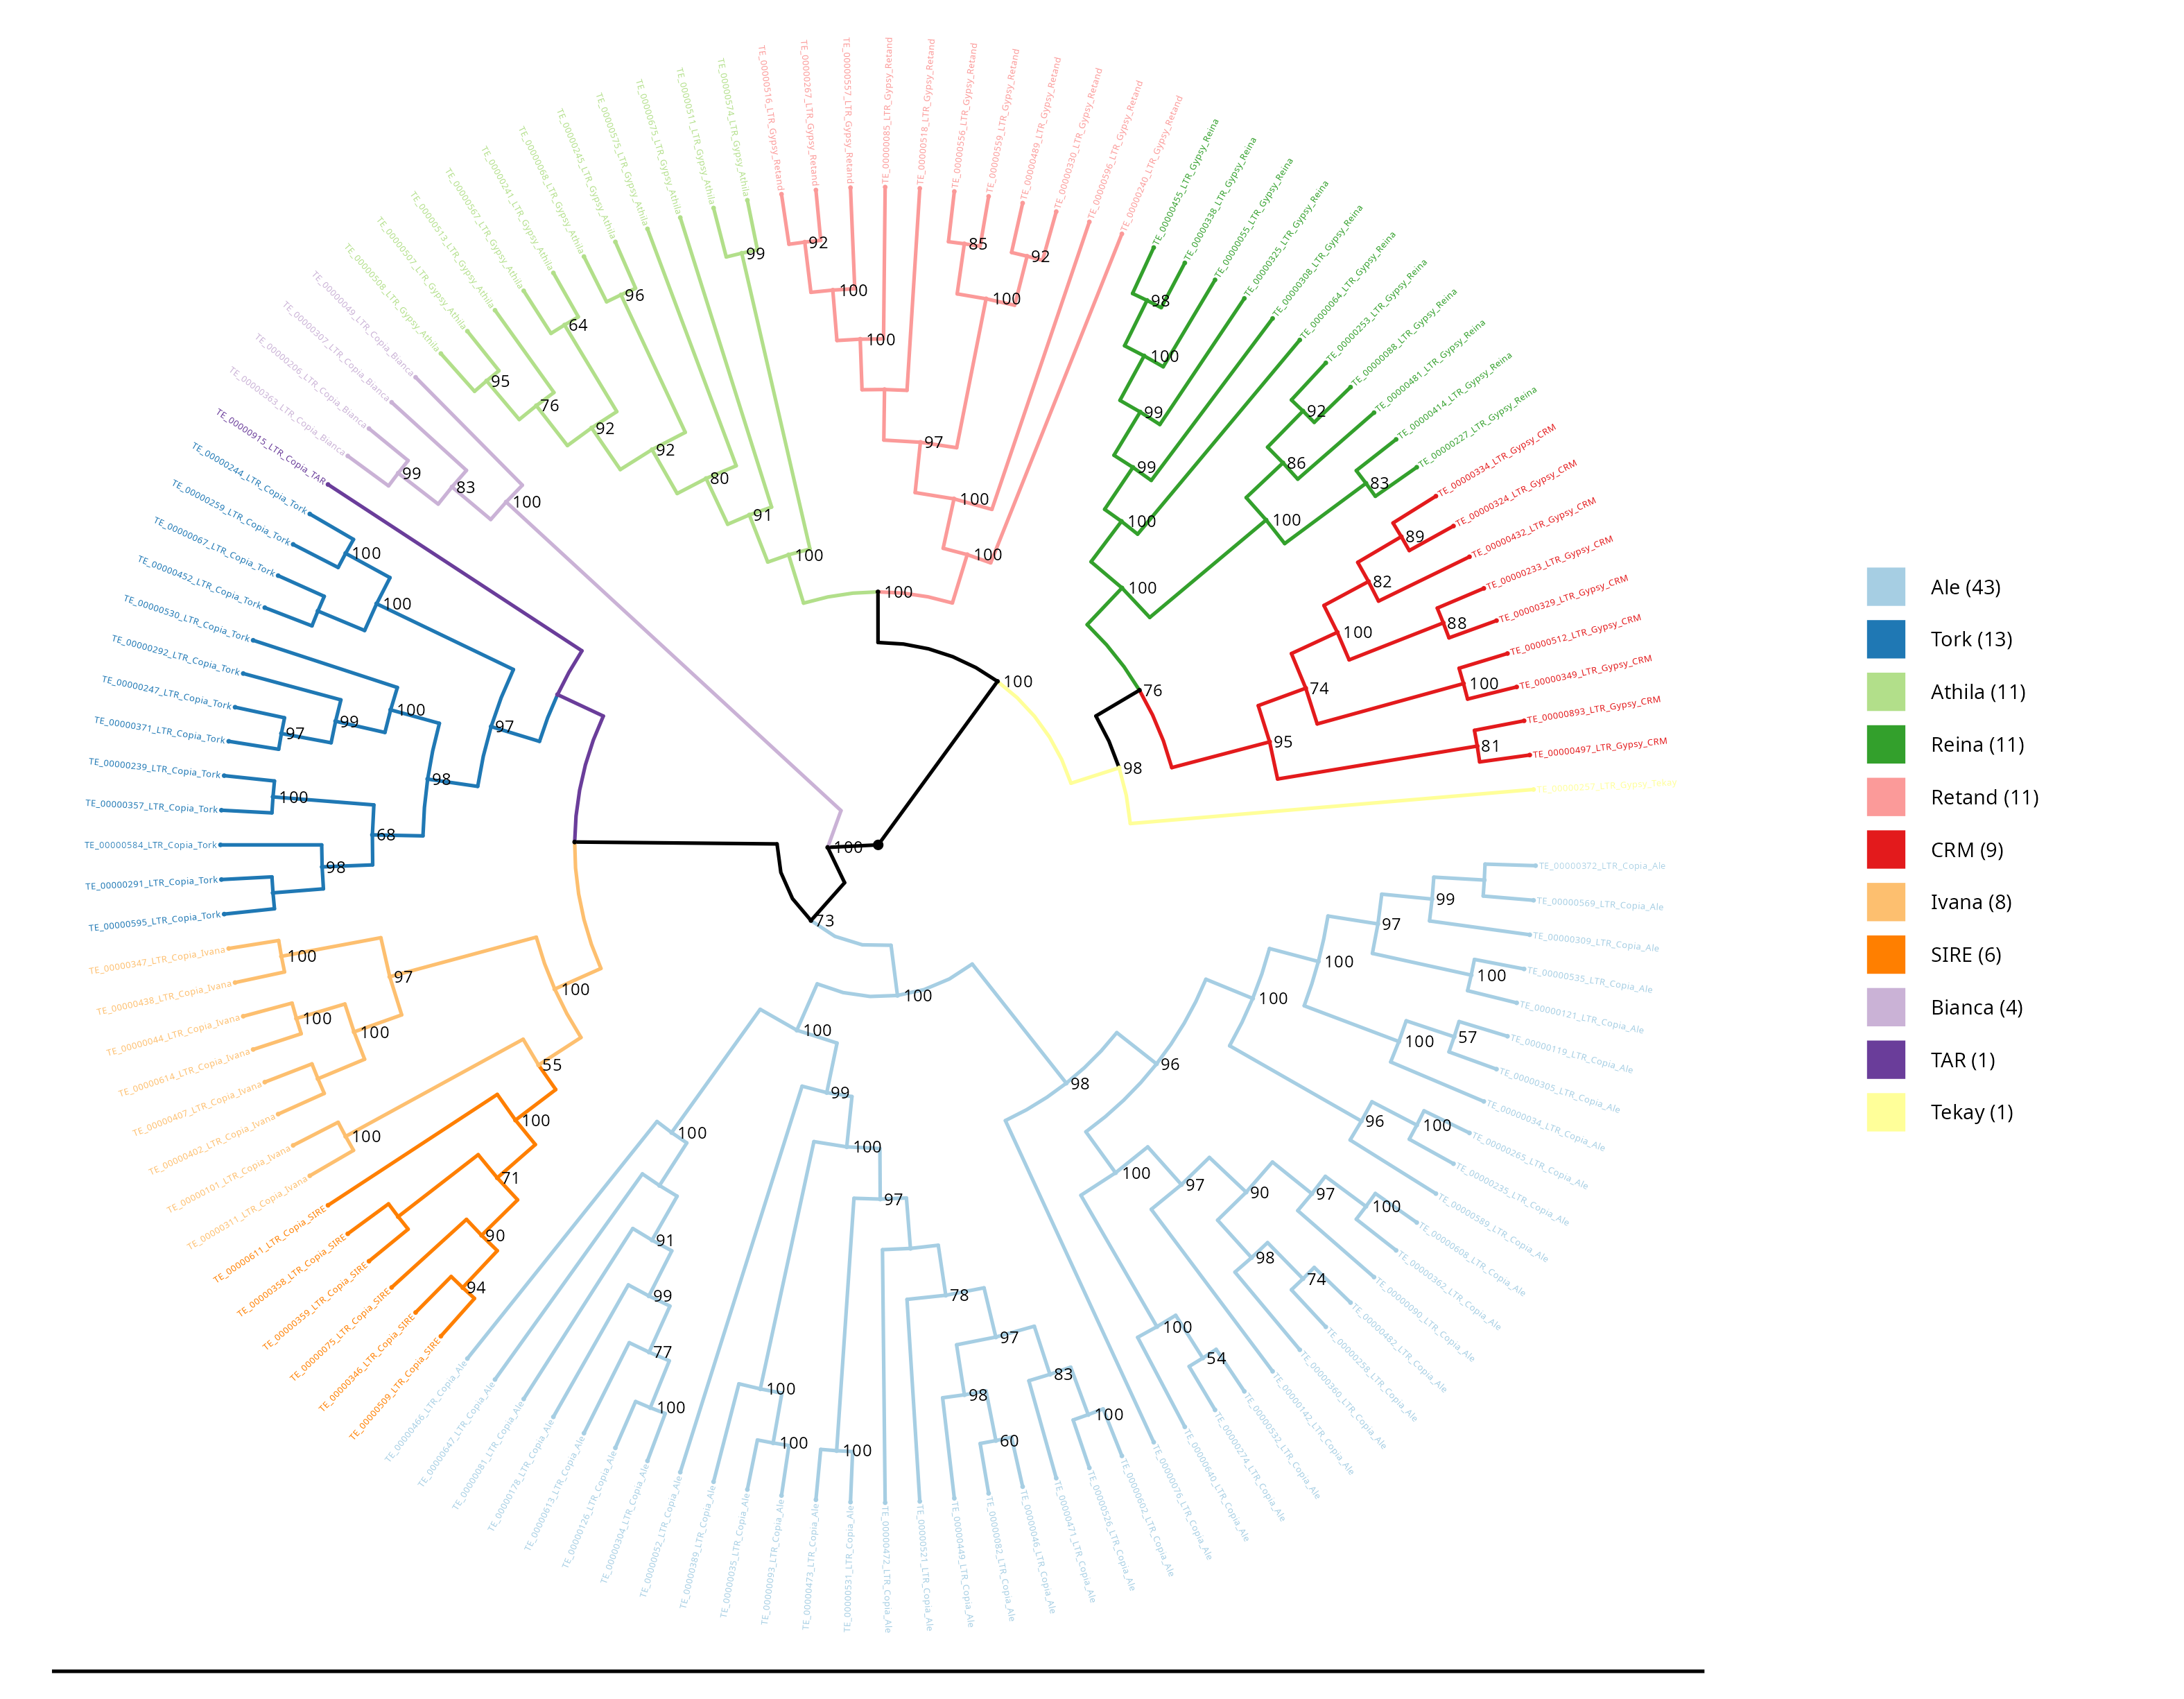
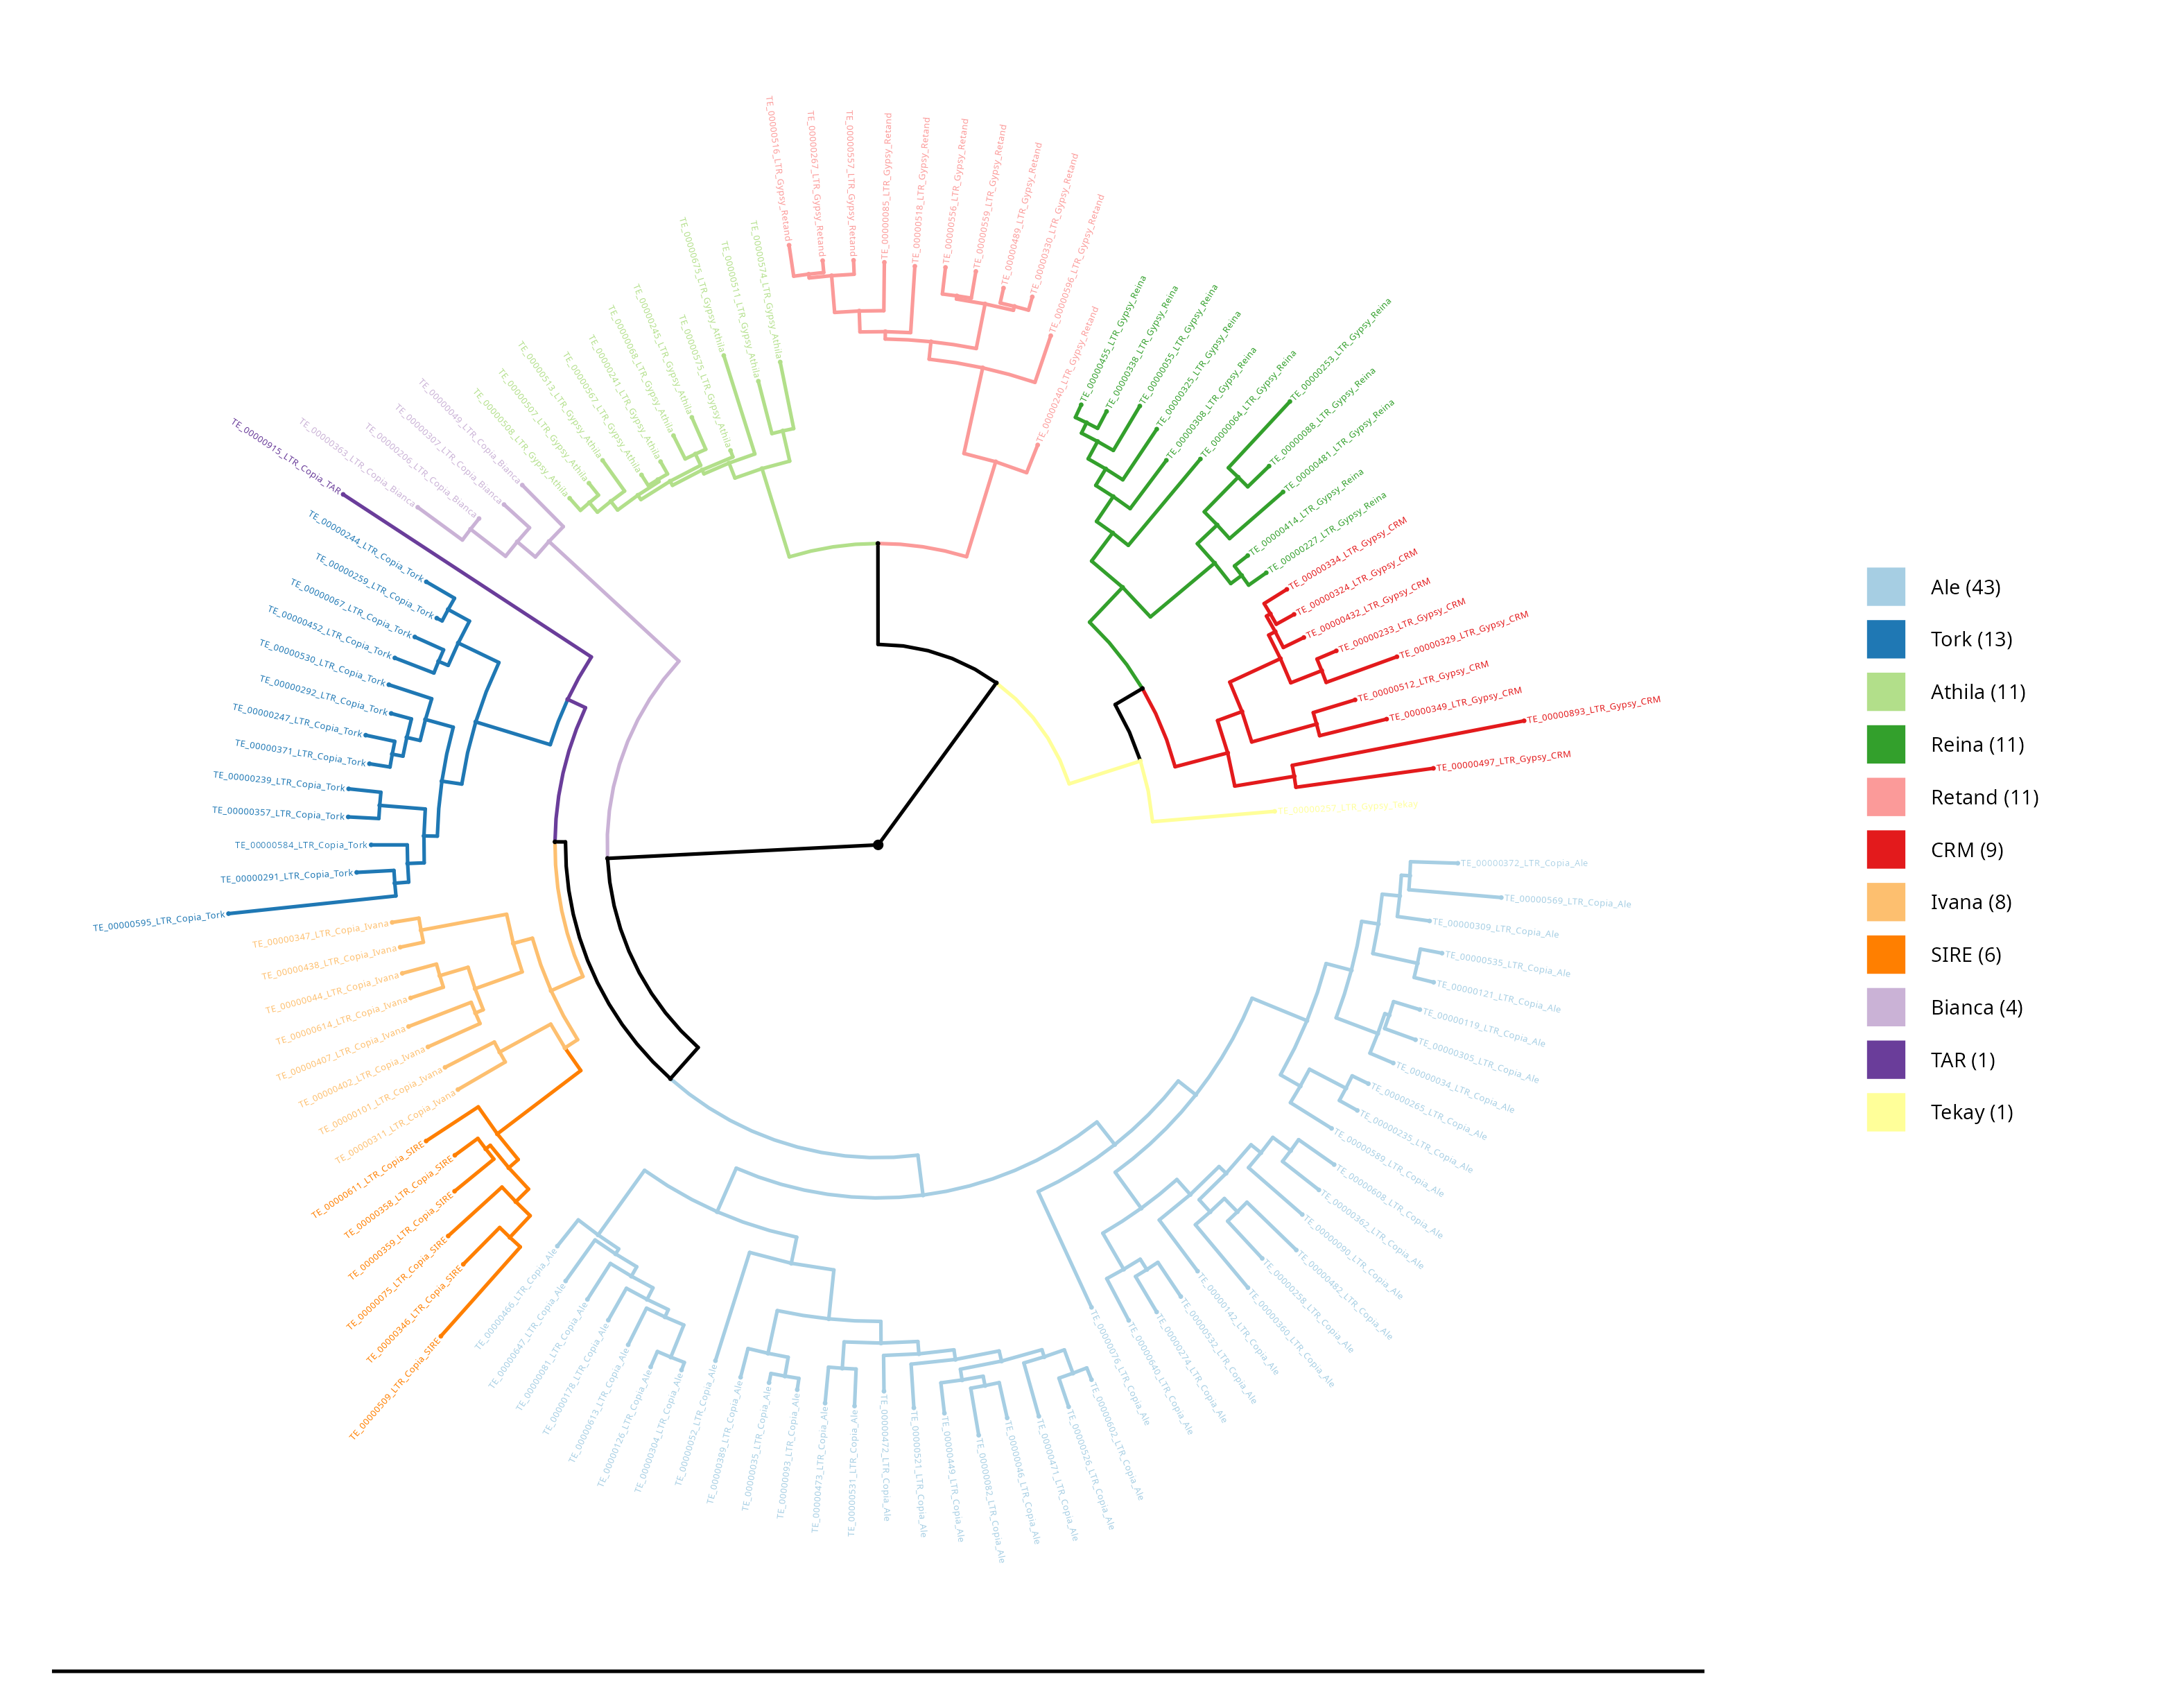
LTR Phylogeny
In this section, the phylogeny of lineage alignments within LTR superfamilies is constructed, providing a comprehensive visualisation of their evolutionary relationships. The phylogeny is a graphical representation that illustrates how different LTR-RT domains are related to each other based on their genetic sequences.
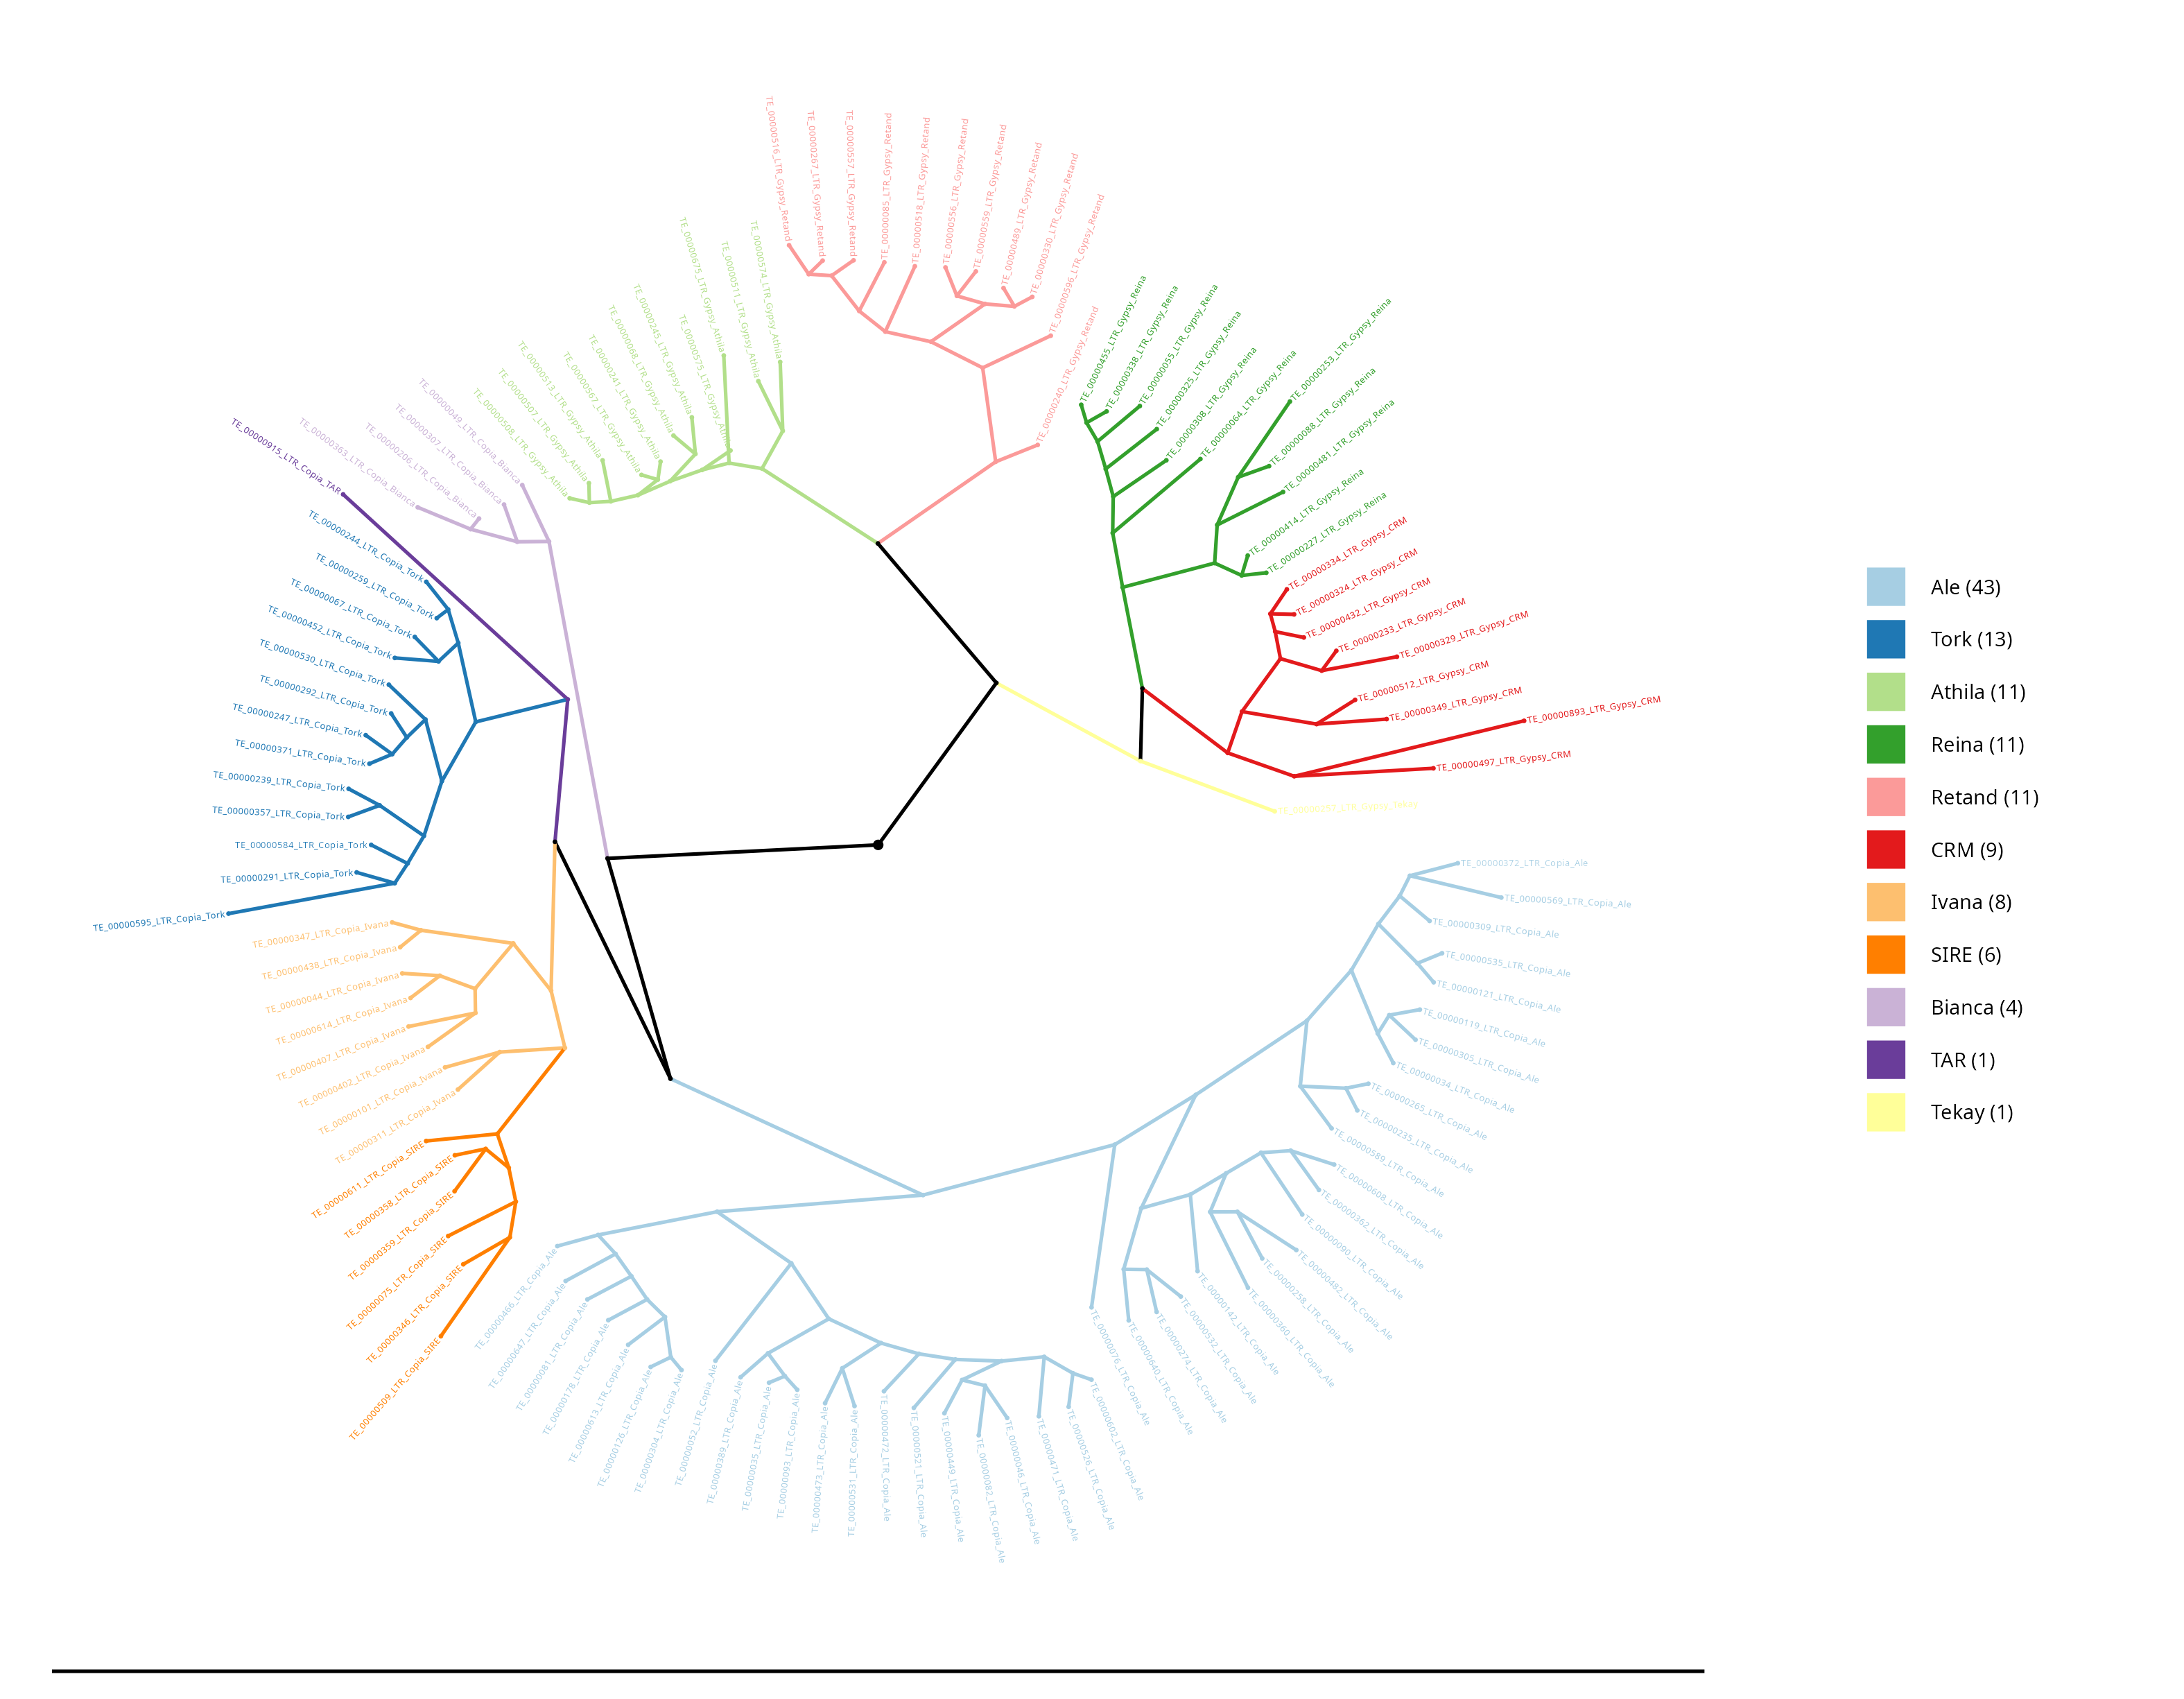
LTR Phylogenetic tree - Density
In this section, the densities of the lineages are shown, with the outer circle (purple) representing the length occupied by each element in base pairs (bp), while the inner circle (red) reflects the number of occurrences of each element.